ALLPCB


Introduction
Debugging is a critical and often time-consuming part of software development. Bugs can be difficult to observe, reproduce, and fix, and the time required to resolve a defect is unpredictable. Once a product is delivered to customers, the cost of fixing problems rises significantly. For many developers, the debugging facilities available in a system are an important factor to consider.
Many practical ARM processor based embedded systems have limited input/output. This means common desktop debugging techniques, such as using printf(), may not be available. Many IoT devices lack a display or serial console. Historically, developers used external hardware tools such as logic analyzers and oscilloscopes to observe program behavior.
Modern processors are complex SoCs with caches, memory subsystems, and many peripherals. Internal processor signals are often not observable off-chip, so external logic analyzers cannot directly monitor internal activity. For this reason, ARM systems generally include dedicated hardware to provide extensive control and observability for debugging.
ARM Debug Hardware
Cortex-A series processors provide hardware features that enable debuggers to control processor activity and non-invasively collect detailed program execution data. Hardware features can be classified as invasive or non-invasive.
Invasive debugging provides tools that can halt execution and step through instructions or source code. This typically requires an external device connected to JTAG pins on the processor chip or, less commonly, debug monitor code in on-chip ROM. JTAG stands for Joint Test Action Group and corresponds to IEEE 1149.1; it was originally designed for board-level testing but is widely used for processor debug.
A typical JTAG connection has five signals: two inputs, a clock, a reset, and one output.
Debuggers provide execution control: pause at a point, single-step, resume, and set breakpoints. Breakpoints can be implemented in two ways:
- Software breakpoints. Replace the instruction to be halted with a BKPT instruction to generate a software breakpoint. This method requires code to be in writable memory, typically RAM. The debugger must track replaced opcodes so it can restore them when execution continues. Software breakpoints can be numerous.
- Hardware breakpoints. Use on-chip comparators to stop execution automatically at a specified address. Hardware breakpoints do not modify code and can be used on any addressable code region, but the number of hardware breakpoint units is limited (Cortex-A series typically provides only four). Debuggers can support more sophisticated breakpoints, such as address-range matching or conditional events. Data watchpoints allow the debugger to trigger when a specific data address or range is read or written.
Debug events are occurrences during program execution that notify the debugger. Debug events may be synchronous or asynchronous; breakpoints, BKPT instructions, and watchpoints are synchronous events. When one of these events occurs, the processor can respond in several ways:
- Ignore the event.
- Raise a debug exception.
- Enter one of two debug modes based on debug status and control register settings: monitor debug mode or halting debug mode.
Both monitor and halting debug modes are examples of invasive debugging.
Halting Debug Mode
In halting debug mode, a debug event causes the processor to enter a debug state and be stopped, isolating it from the rest of the system. The debugger can then inspect memory and the effects of MMU and cache operations. While halted, the processor cannot process interrupts until the debugger restarts execution. External debug controllers typically use Debug Instruction Transfer Registers (DBGITR) to query processor state and control subsequent instruction execution.
Monitor Debug Mode
In monitor debug mode, a debug event generates a debug exception that must be handled by software debug monitor code. Because the processor continues to run, interrupts can still be serviced. Monitor mode requires a debug monitor in the target system that handles the exception and performs necessary debug tasks.
ARM Trace Hardware
Non-invasive debugging, usually referred to as tracing in ARM documentation, observes processor behavior during execution without perturbing it. Trace can record instruction execution and memory accesses, producing a log of program flow, peripheral accesses, stack/heap activity, and variable changes. For many real-time systems, invasive debugging is impractical. For example, stopping an engine control unit might not be possible while the engine runs, so trace is essential.
Trace hardware is typically provided by an external module connected to the processor, such as Embedded Trace Macrocell (ETM) or Program Trace Macrocell (PTM). SoC designers may omit these modules to reduce cost. A trace module observes processor behavior and can monitor instruction execution and data accesses without affecting execution.
Two main challenges affect trace capture. First, modern processors run at very high frequencies; even seconds of operation can execute trillions of cycles, which is a lot of information to capture. Second, processors may perform multiple 64-bit cache accesses per cycle, which requires very high bandwidth to record addresses and data values.
Chip pin count is limited, and trace output pins often run at lower speeds than the processor clock. For example, a 1 GHz processor generating 100 bits per cycle cannot be exported directly on a chip that can only output 4 trace bits at 200 MHz. To address this, trace macrocells compress trace information to reduce bandwidth. The primary approach is to control the trace module so it collects only selected information, for example only control flow without data values, or trace only a specific peripheral or function.
Storing trace in an on-chip buffer, the Embedded Trace Buffer (ETB), helps accommodate high capture rates and mitigates the chip's output bandwidth limitations. ETBs add silicon cost and impose a fixed capture capacity. ETBs typically store compressed trace in a circular buffer; common sizes are 8 KB or 16 KB, which can contain trace for several thousand lines of code. When a failure occurs, a running trace buffer provides a history leading up to the fault, which is particularly useful for intermittent and real-time faults.
Hardware trace can substantially reduce time to diagnose faults by precisely showing what executed, when it executed, and what data was accessed. Trace can be used to generate a call trace that records the sequence of function or method calls during execution, aiding root cause analysis.
ARM CoreSight provides trace and debug integration via ETM and related components. The presence and feature set of CoreSight components are determined by the chip designer.
CoreSight Components and Functionality
CoreSight provides extensive functionality for debug and trace, including multi-processor debugging, shared debug and trace pins, and synchronized control during trace windows. Embedded cross-triggering enables tools to synchronize multiple cores, for example stopping all other cores when one core hits a breakpoint. Commercial tools can use trace data to present real-time views of processor registers, memory, and peripherals, and allow forward and reverse single-stepping. Analysis tools can use trace to show performance bottlenecks and execution hotspots. Code coverage tools can use trace to explore call paths, and OS-aware debuggers can provide high-level system context from trace data and optional instrumentation.
Below are key CoreSight components with brief descriptions.
Debug Access Port (DAP)
DAP is an optional CoreSight component. It allows an external debugger to access system memory space directly without forcing the processor into a halted state. Without a DAP, read or write operations may require stopping the processor and executing loads/stores. DAP provides external debug tools access to JTAG scan chains and processor debug and trace registers.
Embedded Cross-Trigger (ECT)
ECT links debug functions across multiple system devices. For example, it can stop other cores when one core hits a breakpoint. ECT uses cross-trigger matrices and interfaces to forward debug status and control between cores and trace macrocells.
AHB Trace Macrocell
An AMBA AHB trace macrocell allows a debugger to see activity on the system memory bus. This captures bus-level transactions that may originate from caches or external memory, which individual core ETMs cannot distinguish.
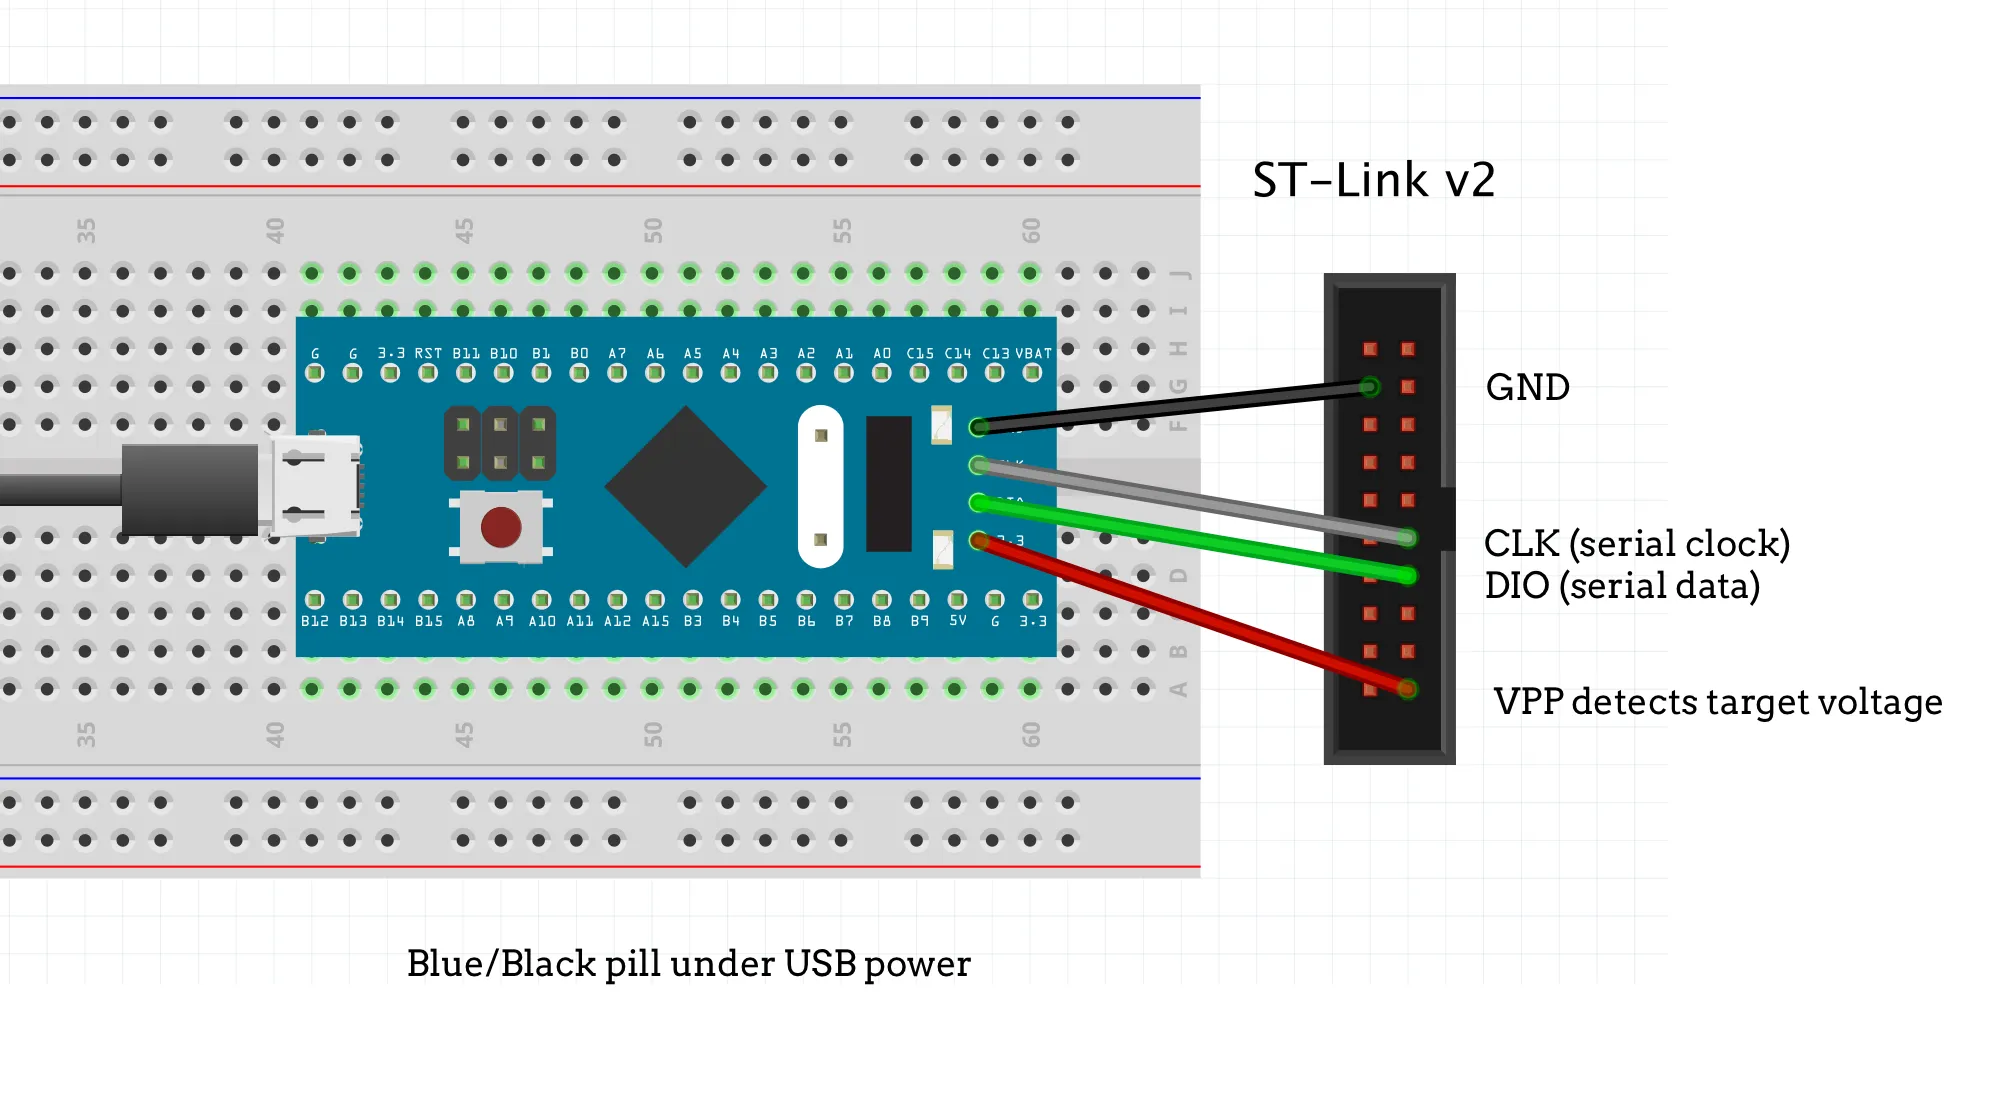
CoreSight Serial Wire
CoreSight serial wire debug uses a 2-pin connection via DAP and provides similar functionality to the 5-pin JTAG interface.
System Trace Macrocell (STM)
STM provides a printf()-style debugging channel for multi-processor systems and processes. Software running on any master device can write to STM channels with simple code fragments without coordinating usage with other software. STM supports timestamped instrumentation that records relative offsets between events.
Trace Memory Controller (TMC)
Adding extra package pins increases cost. For multi-core devices or multiple trace sources, CoreSight TMC can merge multiple trace sources onto a single bus. It provides arbitration and prioritization among inputs. Trace output can be exported via a dedicated trace port, JTAG or serial wire interfaces, or multiplexed onto SoC I/O and stored in an ETB or system memory.
Programmers should consult device documentation to determine available trace features and tool support.
Debug Monitors
ARM architecture provides external debugger access features and also allows debug monitor code to run on the target. Monitor systems are inexpensive because they may not require extra hardware, but they occupy target memory and are usable only when the target system is running. If a system cannot boot to a basic operational state, monitor code has limited value.
Processor breakpoint and watchpoint hardware may be programmed by monitor code running on the processor. When BKPT is executed or a hardware breakpoint matches, the system behaves differently in monitor mode. Rather than an external debugger halting the processor, monitor mode generates an exception that the processor recognizes as debug-related and calls monitor code. Monitor code can collect debug information, log state, or perform other debug tasks.
Many IDEs and source-level tools rely on these mechanisms to implement debugging features.
Debugging Linux Applications and Kernel
Linux is a multitasking OS where each process has its own address space and private page table mappings, which complicates some debugging scenarios. Two common methods are:
- Debugging user-space applications via a gdbserver running on the target that communicates with the host debugger, typically over Ethernet. During a debug session, the kernel continues to run. gdbserver starts the application to be debugged and uses ptrace() to control it. Signals destined for the application are handled by gdbserver, which can inspect state and set breakpoints by inserting code that generates SIGTRAP.
- Kernel debugging using a JTAG debugger. When a breakpoint is executed in the kernel, the system halts. This is a straightforward way to diagnose issues such as driver loading failures or kernel boot problems.
Common techniques include printk() for quick traces and strace for user-space system call tracing. kgdb allows source-level kernel debugging with a remote GDB running on a separate machine. /dev/kmem can provide live access to kernel memory. Linux-aware JTAG debuggers can debug threads, but they typically stop all processors and thus cannot keep other threads running while stopping a single thread. Breakpoints can be set globally or for a specific thread, and software breakpoints usually require the relevant process mapping to be active.
Tools such as ARM DS-5 can debug applications via gdbserver and debug Linux kernels and modules via JTAG. Commercial trace tools like Trace32 provide additional capabilities.
Examples: Cortex-M3 and Zynq-7000 AP SoC
Cortex-M3
Cortex-M3 debug is based on the ARM CoreSight architecture. The processor exposes a Debug Access Port (DAP) bus interface that maps JTAG or serial wire protocols to a DAP bus protocol. CoreSight trace data packets are sent across an Advanced Trace Bus (ATB). For SoCs with multiple trace sources, an ATB funnel merges streams into a single ATB. The merged data is sent to a Trace Port Interface Unit (TPIU) that exports trace off-chip for capture and analysis.
Cortex-M3 provides execution control features including halting, single-stepping, instruction breakpoints, data watchpoints, register and memory access, profiling, and various tracing mechanisms. The core itself no longer contains a JTAG TAP; instead, the DAP interfaces are implemented in-chip as Debug Ports such as SWJ-DP (supports JTAG and serial wire) or SW-DP (serial wire only). Chip vendors choose which DP to implement, typically SWJ-DP.
Cortex-M3 may include an ETM that emits trace data to a TPIU for off-chip capture. Debug events such as breakpoints, watchpoints, faults, or external debug requests can trigger debug actions. Cortex-M3 also supports an Instrumentation Trace Macrocell (ITM), which software can write to so the debugger collects and displays that data via the trace interface. Debug components are controlled via the DAP interface and trace information is accessible via the TPIU.
Zynq-7000 AP SoC
Zynq-7000 provides standard JTAG (IEEE 1149.1) debug interfaces, including an ARM DAP inside the PS and a standard JTAG TAP inside the PL. The ARM DAP is part of ARM CoreSight and enables third-party debug tools to access the system. The Xilinx TAP controller extends JTAG functionality to support PL debug, fuse/BRAM programming, and XADC access. Shared trace buffers and cross-trigger interfaces between PL and PS allow concurrent debugging of ARM software via DAP and PL hardware via TAP.
Key JTAG-related features include boundary-scan support, two TAP controllers (JTAG TAP and ARM DAP), unique device identification for family devices, IEEE 1532 online programming support, board-level flash programming, and system address space access through DAP-AP ports. External trace interfaces are available via MIO or EMIO.
Debug Security
JTAG is widely used for board- and chip-level testing and debugging. It enables firmware download and runtime examination of CPU registers and memory. Because JTAG often provides deep access to a device, open JTAG interfaces can be exploited by attackers to extract firmware, read or modify keys, disable system components, or install unauthorized functions. Attacks via JTAG can be more direct than those via other interfaces because they access both memory and processor state.
Defenses against JTAG-based attacks can combine physical/hardware obscuration and authentication mechanisms.
Hardware obscuration techniques include changing default input voltages for JTAG pins, remapping JTAG pin assignments to make physical identification harder, or implementing fuses that disable JTAG after firmware deployment.
Authentication-based protections typically use an external security controller that mediates access to JTAG. For example, a microcontroller can implement a challenge-response protocol to authenticate external JTAG tools. After successful authentication, the controller forwards debug commands to the chip. Other approaches include password or key-based authentication before JTAG is enabled or custom gating logic to control access.
Conclusion
CoreSight and related debugging technologies provide a powerful set of capabilities for observing and controlling ARM-based systems. From invasive halting debug to non-invasive trace, these features support debugging across a wide range of target scenarios, including real-time and multi-core systems. Device documentation should be consulted to determine the specific debug and trace components available on a product. Companies such as DS and Lauterbach operate in specialized segments, and there are relatively few such tool vendors in the Chinese market.