ALLPCB


Introduction
Thermal profiling plays a critical role in PCB assembly, particularly during reflow soldering processes where precise temperature control determines solder joint quality and component reliability. Analyzing thermal profiling data allows engineers to pinpoint deviations that could lead to defects like incomplete reflow, overheating, or tombstoning. By extracting actionable insights from this data, teams can fine-tune oven settings, optimize conveyor speeds, and enhance overall process yields. This article delves into practical methods for analyzing thermal profiling data, focusing on identifying temperature variations, peak temperature analysis, time above liquidus analysis, and process window index (PWI). Electric engineers benefit from these techniques to troubleshoot real-world assembly challenges and maintain compliance with industry benchmarks. Mastering these analyses transforms raw temperature logs into strategies for continuous process improvement.
What Is Thermal Profiling Data Analysis and Why It Matters
Thermal profiling data analysis involves capturing and evaluating temperature-time curves from multiple points on a PCB as it travels through a reflow oven. Data loggers equipped with thermocouples record these profiles, providing a snapshot of heat exposure across the board. Engineers scrutinize these curves to ensure the profile aligns with solder paste specifications and component tolerances. Without thorough analysis, subtle shifts in temperature can cause widespread defects, reducing first-pass yields and increasing rework costs. In high-volume production, consistent profiling data analysis prevents variability introduced by board thickness, component density, or oven zoning imbalances. Ultimately, it empowers electric engineers to validate process stability and predict potential failures before they impact reliability.
This practice matters because modern assemblies feature diverse components with tight thermal margins, such as fine-pitch BGAs or moisture-sensitive devices. Variations undetected in analysis can lead to issues like voiding or delamination, compromising long-term performance. By routinely analyzing thermal profiling data, teams adhere to guidelines outlined in IPC-7530, which provides frameworks for profiling mass soldering processes. The insights gained support data-driven decisions, minimizing scrap and accelerating time-to-market for complex boards.
Key Technical Principles of Thermal Profiling Data
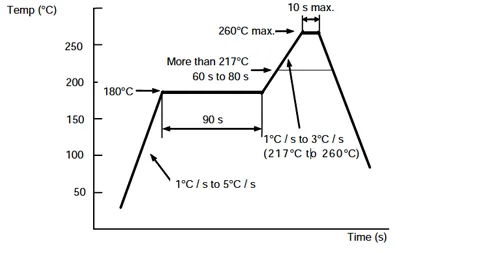
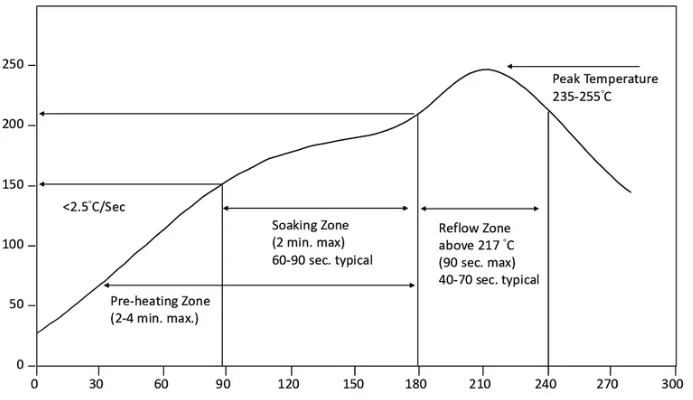
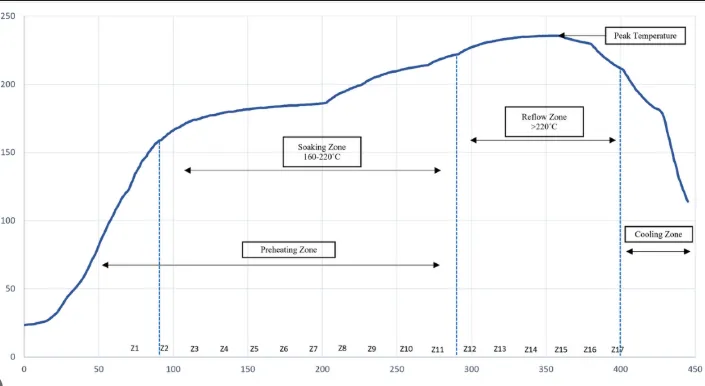
Understanding the reflow profile's stages forms the foundation of effective data analysis. A typical profile includes preheat, soak, reflow, and cooling phases, each with specific ramp rates and durations to activate flux, homogenize temperature, melt solder, and solidify joints. Preheat ramps gently from room temperature to avoid thermal shock, typically at 1-3°C per second. The soak phase evens out temperatures across the board, preventing hot spots that could damage components. Reflow then pushes temperatures above the solder liquidus for proper wetting, followed by controlled cooling to form reliable intermetallics.
Peak temperature analysis evaluates the maximum heat exposure at each thermocouple location, ensuring it stays within component limits, often 235-260°C for lead-free SAC alloys. Exceeding peaks risks pad lifting or package cracking, while insufficient peaks lead to cold joints. Time above liquidus analysis measures duration above the solder's melting point, around 217°C for common alloys, ideally 45-90 seconds for full reflow without excessive intermetallic growth. Engineers plot these metrics from raw data to compare against specifications, identifying if the profile supports uniform solder flow.
Temperature variations arise from factors like board warpage, copper balance, or airflow in the oven. Multi-channel profiles reveal deltas between hottest and coldest spots, often exceeding 10-20°C in unoptimized setups. Analyzing these helps adjust nitrogen flow or zone temperatures for better uniformity. According to IPC/JEDEC J-STD-020, profiles must accommodate moisture-sensitive components, making variation control essential for classification levels.
Identifying Temperature Variations in Profiling Data
Spotting temperature variations starts with overlaying multiple thermocouple channels in analysis software. Channel-to-channel deltas highlight inconsistencies, such as a 15°C spread between edge and center points due to uneven conveyor heating. Board-to-board comparisons over several runs detect drift from belt speed changes or paste volume inconsistencies. Engineers quantify these by calculating standard deviations across profiles, flagging runs where variation exceeds 5% of the process window.
Visual inspection of curves reveals anomalies like spikes from poor thermocouple attachment or plateaus indicating insufficient soak. Cross-referencing with PCB layout identifies hotspots near high-power components or ground planes. For thick boards, bottom-side profiles often lag top-side by 10-30°C, necessitating slower ramps. Practical troubleshooting involves correlating variations with defect maps from X-ray or AOI inspections.
To mitigate, segment the board into thermal zones based on data: high-mass areas needing longer preheat, sparse regions at risk of overheating. Iterative profiling refines oven recipes, reducing variations to under 10°C across the assembly. This targeted approach ensures every joint meets wetting criteria without overexposing sensitive parts.
Peak Temperature Analysis and Time Above Liquidus
Peak temperature analysis focuses on the reflow zone summit, verifying all channels peak within a narrow band above liquidus. Data review checks if peaks align with alloy activation, avoiding under-reflow that leaves dull joints or over-reflow causing bridging. Engineers set alarms for excursions beyond 260°C, common for MSL-rated devices per IPC/JEDEC J-STD-020 guidelines.
Time above liquidus (TAL) analysis integrates time spent above liquidus from the curve's slope. Short TAL under 45 seconds signals ramp-up issues, leading to incomplete fluxing; prolonged over 120 seconds promotes brittleness. Balancing TAL with peak height optimizes microstructure, with software automating integral calculations for dozens of profiles.
Combining these, engineers assess joint integrity: high peaks with short TAL suit thin boards, while lower peaks extend TAL for dense assemblies. Trend analysis over production shifts predicts maintenance needs, like heater element degradation.
Process Window Index (PWI): A Comprehensive Metric
The process window index (PWI) quantifies profile robustness by comparing actual temperatures against upper and lower limits for each parameter. Calculated as a percentage, PWI sums normalized deviations across ramp rates, TAL, peaks, and cooling, with values under 100 indicating a centered, capable process. Low PWI reflects margin for variability, ideal for high-mix production.
Engineers define windows per solder paste data sheets: preheat 1-3°C/s, TAL 60-90s, peak 240-250°C. Software computes PWI from multi-run data, alerting when scores exceed 75 due to tightening margins. Troubleshooting high PWI pinpoints culprits, like excessive cooling rates over 4°C/s risking cracks.
PWI integrates peak temperature analysis, TAL, and variations into one score, guiding optimizations like zone balancing. Regular monitoring establishes baselines, enabling predictive adjustments before defects emerge.
Best Practices for Actionable Insights and Process Improvement
Start profiling with strategic thermocouple placement: four to eight per board at corners, center, under largest components, and thick copper traces. Use high-frequency logging at 1-second intervals for accuracy. Post-run, normalize data to conveyor speed and overlay historical profiles for trends.
Apply statistical tools: calculate CpK for key parameters, correlating low values with yield drops. For variations, heat mapping visualizes deltas, prioritizing fixes like board fixturing. Simulate changes virtually before physical trials to save time.
Document insights in a process control plan, linking PWI to acceptance criteria. Train operators on quick data reviews, fostering a culture of proactive tweaks. These practices yield 20-30% defect reductions in reflow-heavy lines.
Troubleshooting Common Profiling Issues
When profiles show erratic ramps, check thermocouple integrity and attachment methods, like high-temp solder or epoxy. Board warpage exaggerates variations; validate with shadow moiré testing pre-assembly. Insufficient TAL often traces to short reflow zones or high belt speeds, addressed by extending dwell.
Overheating peaks signal nitrogen purity drops or soiled belts; clean and requalify. High PWI from cooling faults requires fan adjustments. Always cross-verify with shear strength tests post-analysis.
Case in point: A multi-layer board exhibited 25°C deltas, resolved by adding preheat time and tweaking zones, dropping PWI from 120 to 65.
Conclusion
Analyzing thermal profiling data unlocks precise control over reflow processes, turning potential defects into reliable assemblies. Key techniques like identifying temperature variations, peak temperature analysis, time above liquidus analysis, and PWI provide clear paths to optimization. Electric engineers leveraging these insights enhance yields, comply with standards like IPC-7530, and build robust products. Routine application ensures process stability amid evolving designs. Commit to data-driven profiling for sustained improvements in PCB assembly performance.
FAQs
Q1: How do you perform peak temperature analysis in thermal profiling data?
A1: Peak temperature analysis involves extracting maximum values from each thermocouple channel and comparing them to component specs, typically 235-260°C for lead-free. Overlay curves to spot outliers, ensuring no channel exceeds limits that risk damage. Correlate peaks with solder wetting via cross-section analysis for validation. This identifies oven zoning issues early.
Q2: What is time above liquidus analysis and its importance?
A2: Time above liquidus analysis measures seconds above the solder melt point, around 217°C, ideally 45-90s for SAC alloys. Short TAL causes poor reflow; excess leads to defects. Integrate curve areas post-liquidus entry/exit for precision. It ensures uniform joints across varying board conditions.
Q3: How does process window index (PWI) aid in analyzing thermal profiling data?
A3: PWI evaluates profile fit within spec limits for all parameters, scoring robustness on a percentage scale. Lower PWI means better margins against variations. Compute from multi-profile data to benchmark processes. Use it to prioritize adjustments like ramp tuning.
Q4: Why focus on identifying temperature variations in PCB thermal profiles?
A4: Identifying temperature variations prevents defects from uneven heating, like bridging or voids. Analyze channel deltas and map to layout hotspots. Adjust oven settings accordingly for uniformity under 10°C. This boosts reliability in high-density assemblies.
References
IPC-7530 — Guidelines for Temperature Profiling for Mass Soldering Processes (Reflow and Wave). IPC, 2017
IPC/JEDEC J-STD-020F — Moisture/Reflow Sensitivity Classification for Nonhermetic Surface Mount Devices. IPC/JEDEC, 2023