ALLPCB


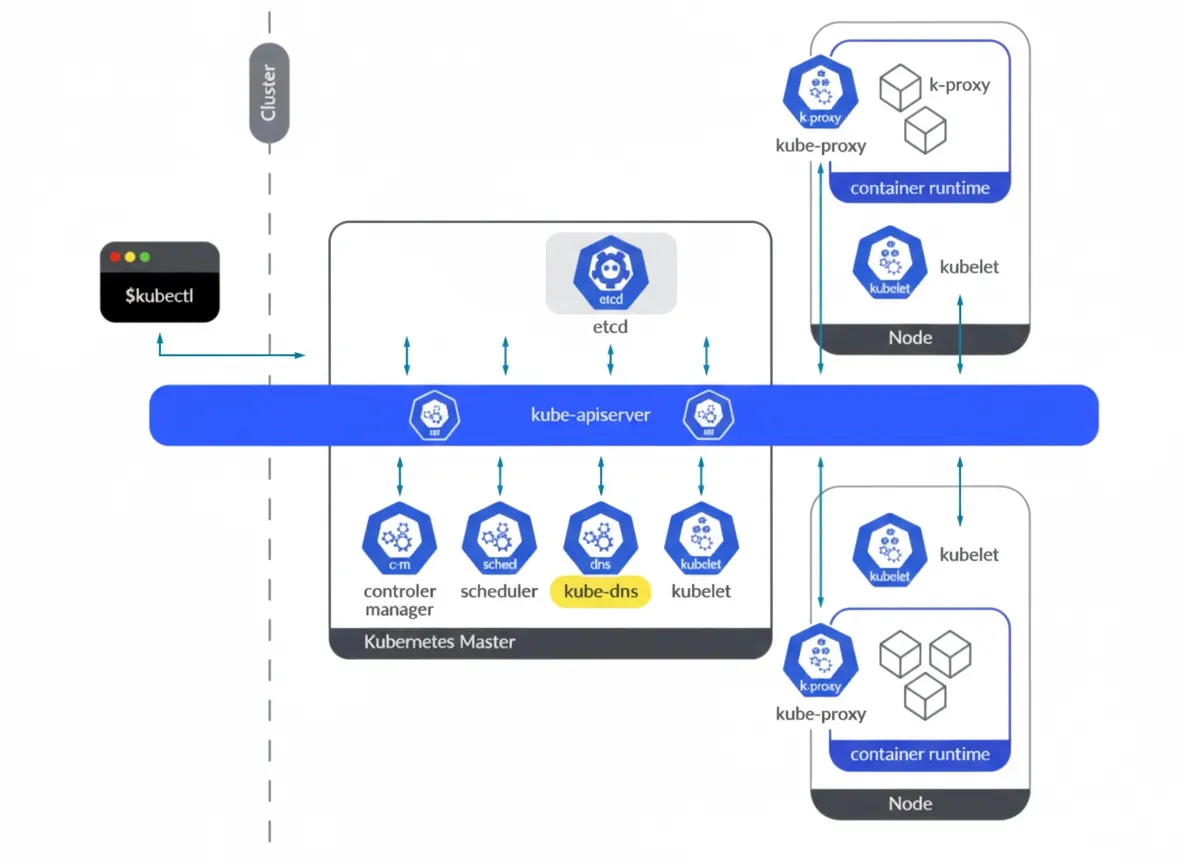
CoreDNS is the DNS add-on component for Kubernetes. It runs on control plane nodes and is critical for cluster operation and responsiveness. Understanding how to monitor CoreDNS and which metrics matter is essential for operations teams.
Why DNS matters
DNS is one of the most sensitive and important services in any architecture. Applications, microservices, services, and hosts all rely on DNS. DNS resolves domain names and maps internal or external services to Pod IPs. Maintaining DNS records for Pods is especially important because Pod IPs can change without warning.
If you run workloads on Kubernetes and need to monitor CoreDNS, this article explains how to scrape CoreDNS metrics with Prometheus, which metrics to check, and what they mean.
What is Kubernetes CoreDNS?
Starting with Kubernetes 1.11, CoreDNS was introduced as a replacement for kube-dns after DNS-based service discovery reached general availability. CoreDNS is the de facto DNS engine for Kubernetes clusters. Written in Go, CoreDNS is widely adopted for its flexibility.
kube-dns historically implemented DNS functionality in a single Pod that contained three different containers: kubedns, dnsmasq, and a sidecar. Briefly:
- kubedns: SkyDNS implementation responsible for DNS resolution inside the cluster. It watches Kubernetes A records and provides appropriate DNS records.
- dnsmasq: Provides DNS caching for SkyDNS queries.
- sidecar: Exports metrics and performs health checks for the DNS service.
CoreDNS addressed several issues present in kube-dns. dnsmasq introduced some security concerns that required patches, and kube-dns required three containers to provide all functions. CoreDNS provides the DNS functionality in a single container and resolves several issues related to stub domains for external services.
CoreDNS exposes its metrics endpoint on port 9153 and it can be accessed from Pods or host networks in the cluster.
# kubectl get ep kube-dns -n kube-system -o json | jq -r ".subsets" [ { "addresses": [ { "ip": "192.169.107.100", "nodeName": "k8s-control-2.lab.example.com", "targetRef": { "kind": "Pod", "name": "coredns-565d847f94-rz4b6", "namespace": "kube-system", "uid": "c1b62754-4740-49ca-b506-3f40fb681778" } }, { "ip": "192.169.203.46", "nodeName": "k8s-control-3.lab.example.com", "targetRef": { "kind": "Pod", "name": "coredns-565d847f94-8xqxg", "namespace": "kube-system", "uid": "bec3ca63-f09a-4007-82e9-0e147e8587de" } } ], "ports": [ { "name": "dns-tcp", "port": 53, "protocol": "TCP" }, { "name": "dns", "port": 53, "protocol": "UDP" }, { "name": "metrics", "port": 9153, "protocol": "TCP" } ] } ]
How to access CoreDNS metrics
Each CoreDNS Pod exposes a metrics endpoint on port 9153. You can curl that endpoint to retrieve metrics at /metrics.
Manual access
Once you know the endpoint or IP of a CoreDNS instance, try accessing port 9153.
# curl http://192.169.203.46:9153/metrics # HELP coredns_build_info A metric with a constant '1' value labeled by version, revision, and goversion from which CoreDNS was built. # TYPE coredns_build_info gauge coredns_build_info{goversion="go1.18.2",revision="45b0a11",version="1.9.3"} 1 # HELP coredns_cache_entries The number of elements in the cache. # TYPE coredns_cache_entries gauge coredns_cache_entries{server="dns://:53",type="denial",zones="."} 46 coredns_cache_entries{server="dns://:53",type="success",zones="."} 9 # HELP coredns_cache_hits_total The count of cache hits. # TYPE coredns_cache_hits_total counter coredns_cache_hits_total{server="dns://:53",type="denial",zones="."} 6471 coredns_cache_hits_total{server="dns://:53",type="success",zones="."} 6596 # HELP coredns_cache_misses_total The count of cache misses. Deprecated, derive misses from cache hits/requests counters. # TYPE coredns_cache_misses_total counter coredns_cache_misses_total{server="dns://:53",zones="."} 1951 # HELP coredns_cache_requests_total The count of cache requests. # TYPE coredns_cache_requests_total counter coredns_cache_requests_total{server="dns://:53",zones="."} 15018 # HELP coredns_dns_request_duration_seconds Histogram of the time (in seconds) each request took per zone. # TYPE coredns_dns_request_duration_seconds histogram coredns_dns_request_duration_seconds_bucket{server="dns://:53",zone=".",le="0.00025"} 14098 coredns_dns_request_duration_seconds_bucket{server="dns://:53",zone=".",le="0.0005"} 14836 coredns_dns_request_duration_seconds_bucket{server="dns://:53",zone=".",le="0.001"} 14850 coredns_dns_request_duration_seconds_bucket{server="dns://:53",zone=".",le="0.002"} 14856 coredns_dns_request_duration_seconds_bucket{server="dns://:53",zone=".",le="0.004"} 14857 coredns_dns_request_duration_seconds_bucket{server="dns://:53",zone=".",le="0.008"} 14870 coredns_dns_request_duration_seconds_bucket{server="dns://:53",zone=".",le="0.016"} 14879 coredns_dns_request_duration_seconds_bucket{server="dns://:53",zone=".",le="0.032"} 14883 coredns_dns_request_duration_seconds_bucket{server="dns://:53",zone=".",le="0.064"} 14884 coredns_dns_request_duration_seconds_bucket{server="dns://:53",zone=".",le="0.128"} 14884 coredns_dns_request_duration_seconds_bucket{server="dns://:53",zone=".",le="0.256"} 14885 coredns_dns_request_duration_seconds_bucket{server="dns://:53",zone=".",le="0.512"} 14886 coredns_dns_request_duration_seconds_bucket{server="dns://:53",zone=".",le="1.024"} 14887 coredns_dns_request_duration_seconds_bucket{server="dns://:53",zone=".",le="2.048"} 14903 coredns_dns_request_duration_seconds_bucket{server="dns://:53",zone=".",le="4.096"} 14911 coredns_dns_request_duration_seconds_bucket{server="dns://:53",zone=".",le="8.192"} 15018 coredns_dns_request_duration_seconds_bucket{server="dns://:53",zone=".",le="+Inf"} 15018 coredns_dns_request_duration_seconds_sum{server="dns://:53",zone="."} 698.531992215999 coredns_dns_request_duration_seconds_count{server="dns://:53",zone="."} 15018 ...(output truncated)
You can also access the metrics through the CoreDNS Kubernetes Service that is exposed by default in the cluster.
# kubectl get svc -n kube-system
NAME TYPE CLUSTER-IP EXTERNAL-IP PORT(S) AGE
kube-dns ClusterIP 10.96.0.10 Prometheus provides a set of roles to discover targets and scrape metrics from sources such as Pods, nodes, and services. To scrape CoreDNS running inside the cluster, configure prometheus.yml to use the endpoints role to discover CoreDNS targets. Edit the prometheus ConfigMap that contains prometheus.yml, for example: # kubectl edit cm prometheus-server -n monitoring -o yaml
Then add the following snippet under scrape_configs: - honor_labels: true
job_name: kubernetes-service-endpoints
kubernetes_sd_configs:
- role: endpoints
relabel_configs:
- action: keep
regex: true
source_labels:
- __meta_kubernetes_service_annotation_prometheus_io_scrape
- action: drop
regex: true
source_labels:
- __meta_kubernetes_service_annotation_prometheus_io_scrape_slow
- action: replace
regex: (https?)
source_labels:
- __meta_kubernetes_service_annotation_prometheus_io_scheme
target_label: __scheme__
- action: replace
regex: (.+)
source_labels:
- __meta_kubernetes_service_annotation_prometheus_io_path
target_label: __metrics_path__
- action: replace
regex: (.+?)(?::\d+)?;(\d+)
replacement: $1:$2
source_labels:
- __address__
- __meta_kubernetes_service_annotation_prometheus_io_port
target_label: __address__
- action: labelmap
regex: __meta_kubernetes_service_annotation_prometheus_io_param_(.+)
replacement: __param_$1
- action: labelmap
regex: __meta_kubernetes_service_label_(.+)
- action: replace
source_labels:
- __meta_kubernetes_namespace
target_label: namespace
- action: replace
source_labels:
- __meta_kubernetes_service_name
target_label: service
- action: replace
source_labels:
- __meta_kubernetes_pod_node_name
target_label: node
After redeploying the Prometheus Pod, you should see CoreDNS metric endpoints in the Prometheus UI under Status > Targets. Once discovered, CoreDNS metrics will be available in Prometheus. CoreDNS metrics vary by Kubernetes and CoreDNS version. The examples here use Kubernetes 1.25 and CoreDNS 1.9.3. Check the CoreDNS repository for metrics relevant to your version. Start with availability: the number of CoreDNS replicas running in the cluster can change, so monitor replica count to detect changes that could affect availability or performance. The coredns_build_info metric provides information about the CoreDNS build running on those Pods. count(coredns_build_info)
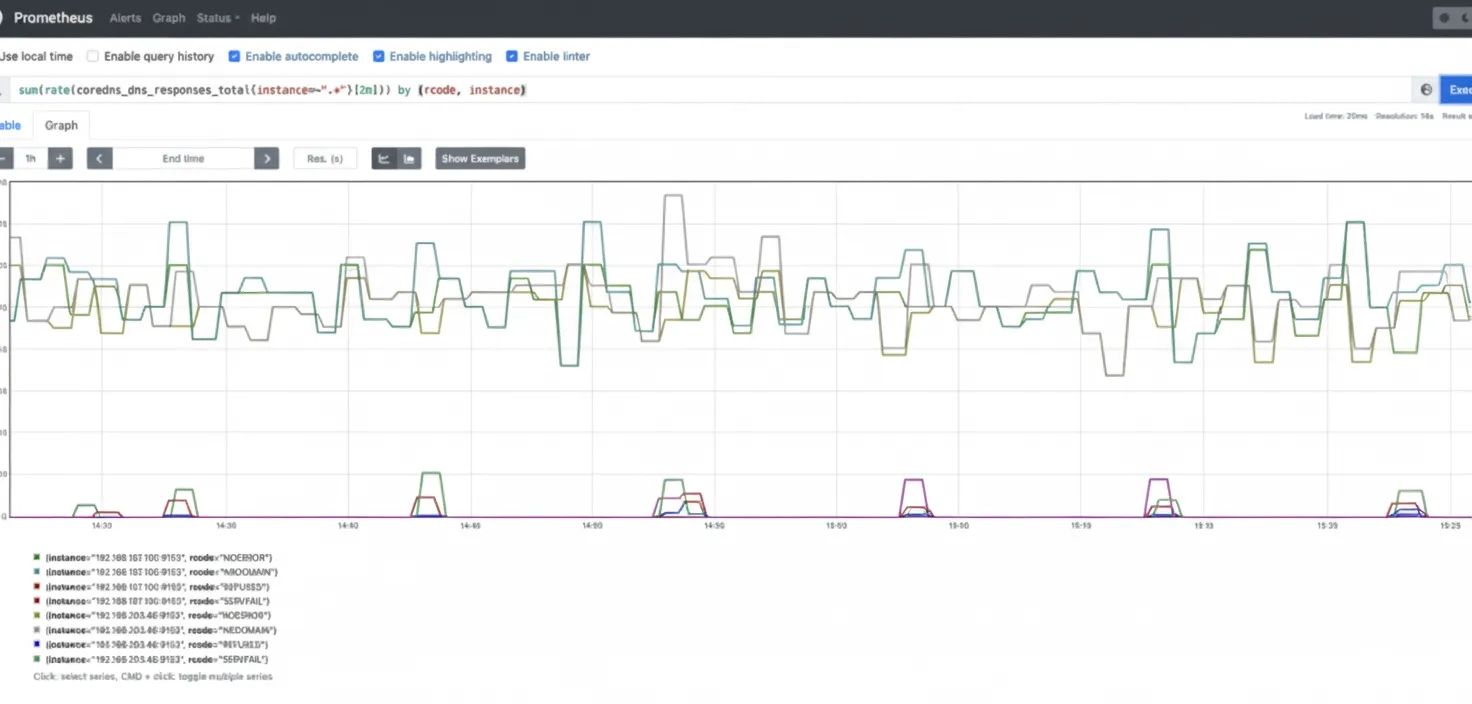
Use the four golden signals approach: errors, latency, traffic, and saturation. The following sections show how to monitor CoreDNS from that perspective. Measuring the number of errors in CoreDNS helps assess cluster, application, and service health. Unexpected DNS error responses can cause serious issues. Watch for SERVFAIL and REFUSED responses when resolving names for internal components and applications. Metric: coredns_dns_responses_total. This counter includes response codes, namespace, and instance. You may want to compute the rate per response code to monitor error rates. sum(rate(coredns_dns_responses_total{instance=~".*"}[2m])) by (rcode, instance)
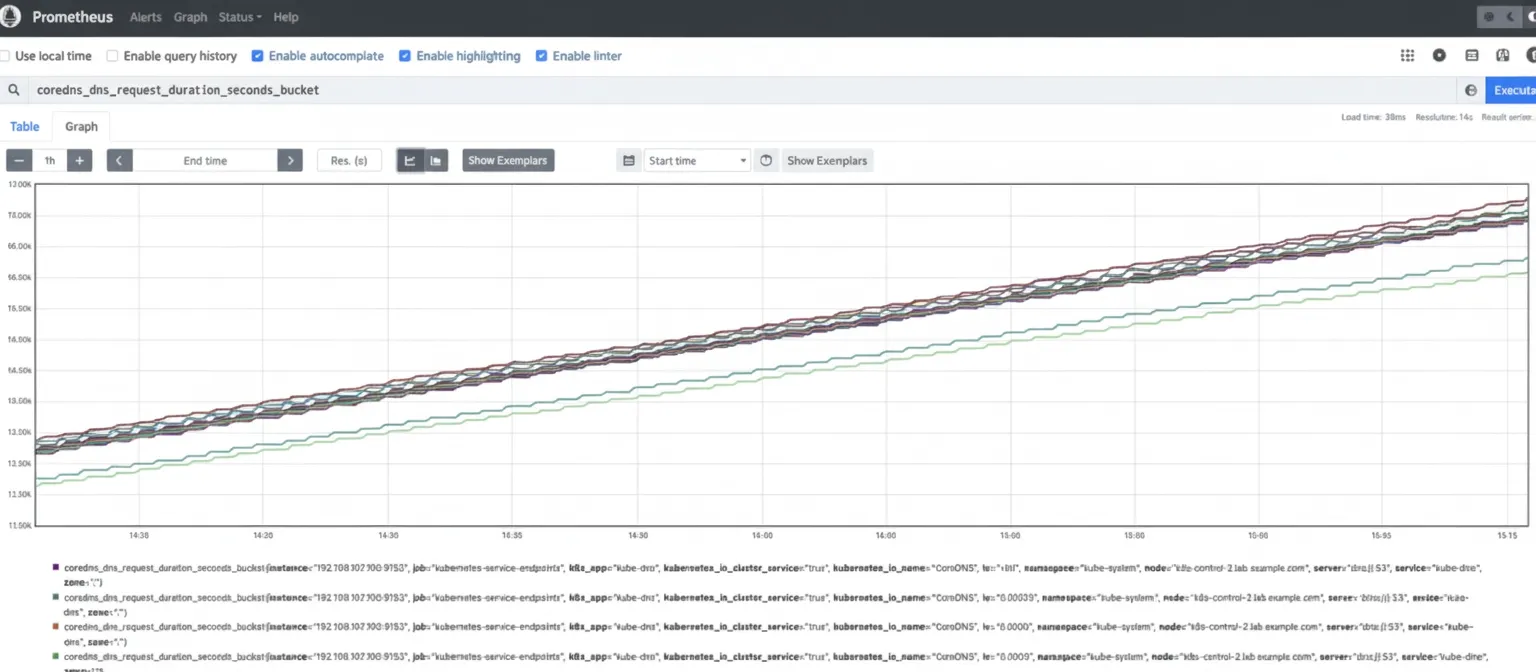
Latency measurement is critical for DNS performance. High or increasing latency may indicate load issues. Overloaded CoreDNS instances can lead to resolution problems and downstream latency or outages. Metric: coredns_dns_request_duration_seconds_bucket. Calculate the 99th percentile to see latency distribution across instances. histogram_quantile(0.99, sum(rate(coredns_dns_request_duration_seconds_bucket{instance=~".*"}[2m])) by (server, zone, le, instance))
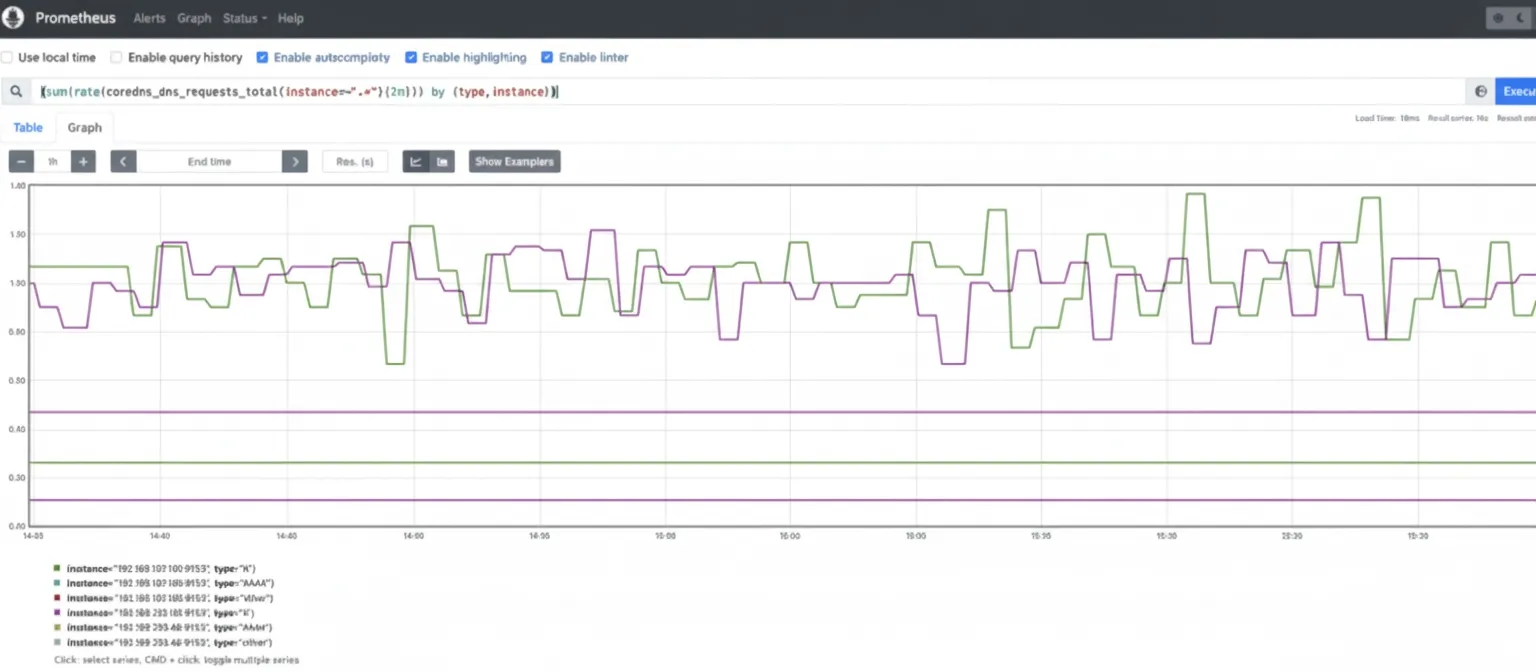
Monitor the request rate handled by CoreDNS. Tracking traffic for spikes or trends is important to maintain performance. Metric: coredns_dns_requests_total. This is a counter by zone, protocol, and series. Monitor request rate by query type, for example A for IPv4 and AAAA for IPv6 queries. (sum(rate(coredns_dns_requests_total{instance=~".*"}[2m])) by (type, instance))
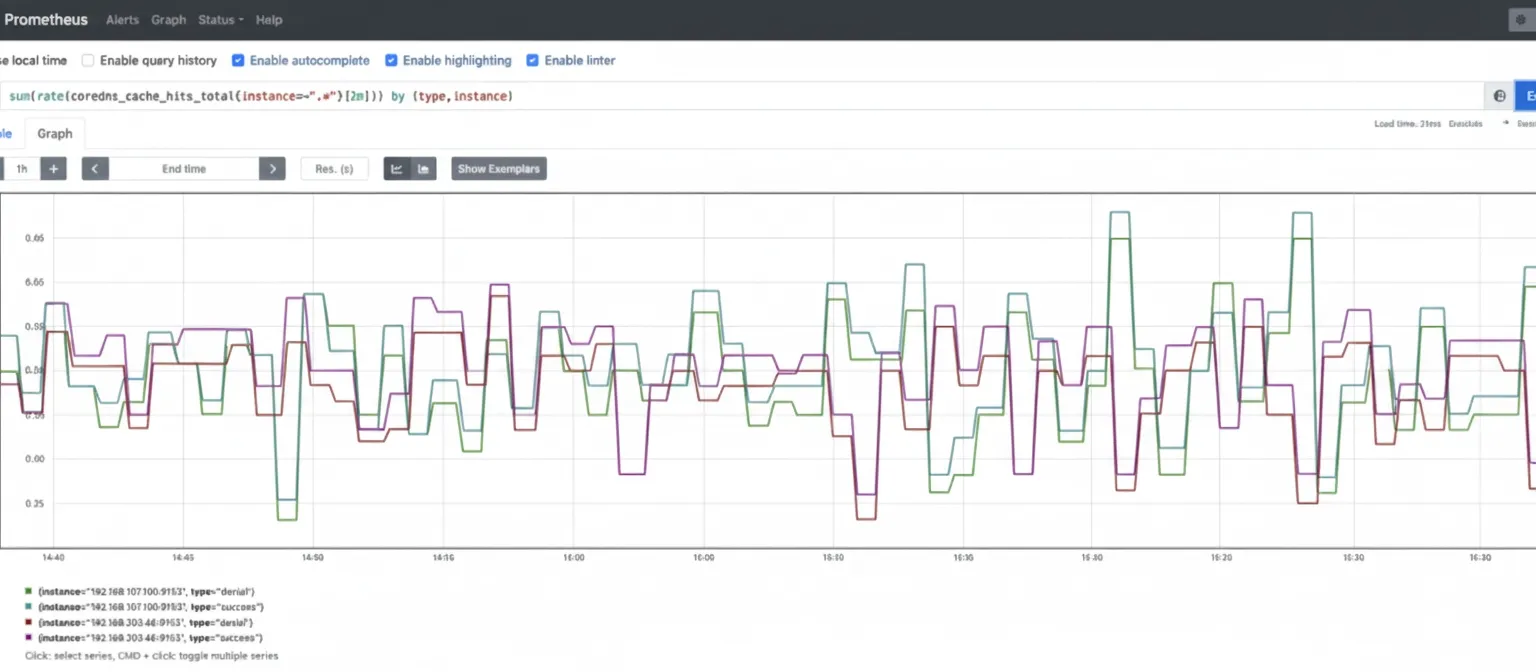
Monitor saturation using system resource metrics such as CPU, memory, and network usage for CoreDNS Pods to detect resource exhaustion. CoreDNS implements a caching mechanism that can cache records for up to 3600 seconds. The cache reduces load and improves performance. Metric: coredns_cache_hits_total. Monitor cache hit rates, including success and denial rates, with a query such as: sum(rate(coredns_cache_hits_total{instance=~".*"}[2m])) by (type, instance)
CoreDNS is a common choice for implementing DNS in Kubernetes because of its flexibility and the issues it addresses compared with kube-dns. DNS is essential to cluster operation, so continuous monitoring of DNS services is necessary to ensure a healthy Kubernetes infrastructure. This article explained how to scrape CoreDNS metrics and configure a Prometheus instance to scrape CoreDNS endpoints. With the key CoreDNS metrics presented here, you can start monitoring CoreDNS in any Kubernetes environment.Configuring Prometheus to scrape CoreDNS
Which metrics should you check?
Errors
Latency
Traffic
Saturation
Cache metrics
Conclusion