ALLPCB


Overview
As code size grows from thousands to millions of lines, embedded software becomes increasingly complex while the overall goal remains delivering robust, correct, and fast-executing code. Fast execution requires efficient use of available CPU and memory resources, which is challenging for embedded systems with constrained RAM.
To manage RAM usage, stack and heap analysis are required. Manually estimating stack and heap usage is difficult, even for small programs. Incorrect estimates can lead to stack overflows and undefined behavior. Some coding standards enforce best practices for memory allocation to avoid unnecessary overhead, but the stack remains a necessary part of RAM that must be optimized.
Why perform stack analysis?
Stack overflow occurs when available stack is smaller than required by the code. Conversely, configuring stack larger than needed wastes memory. Developers must consistently estimate worst-case stack usage for safety-critical applications to avoid runtime RAM shortages.
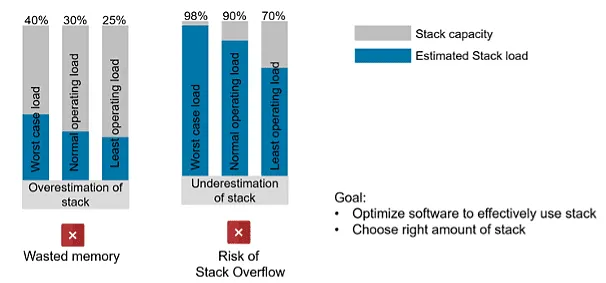
Incorrect stack estimates create significant risk during operation.
How to estimate stack usage
Manual estimation
Manual stack estimation can help in simple cases but is challenging for complex systems. It requires a detailed understanding of call depths, all local variables, and the size of interrupt frames that can occur at runtime, among other factors. This process is time-consuming and error-prone.
Using a static code analyzer
Static analyzers can predict stack usage by analyzing call depth, sizes of local variables and return parameters, nested interrupts, and interrupt frame sizes during execution. Static analysis tools also help detect coding-rule violations, runtime defects, and code complexity that affect stack estimates, producing results in minutes and saving manual effort.
Testing and measurement on target hardware
Static analyzers provide estimates during development, but it is best to obtain actual stack usage data on real hardware. Many development environments provide hardware simulation features and real-time stack analysis. Running stack analysis on real targets and creating overflow scenarios to test fail-safe routines is important. The question is: when should static analysis be used and when should the target be tested?
When to perform stack analysis
Stack analysis is an ongoing activity during the software development lifecycle. If stack estimation is left until the end of development and performed only by a separate QA team, the project is exposed to risk. Fixing problems late in the cycle is error-prone and time-consuming, and it may complicate decisions about hardware versus software design changes.
Recommended times to perform stack analysis include:
- When adding new features: Each new feature can increase stack usage, so developers should monitor the stack impact of new code.
- After implementing major functionality: Apply static analysis locally to specific components or modules to assess the increase in stack usage introduced by new implementations.
- Throughout development: QA and product owners can integrate static analysis into the continuous integration pipeline to display stack estimates on dashboards, enabling tracking of stack usage over the development lifecycle.
- Before release: Static analysis estimates provide evidence that stack usage is under control. Prior to each release, run stack analysis on real targets under standard, minimal, and maximal workloads to understand stack behavior. Verify fail-safe routines for stack overflow and underflow events.
Role of Polyspace in stack estimation
Polyspace Code Prover computes conservative and optimistic bounds on the sizes of local variables in each function to produce function-level and program-level maximum and minimum stack usage. The analysis accounts for return value sizes, parameter sizes, local variable sizes, and additional padding needed for memory alignment.
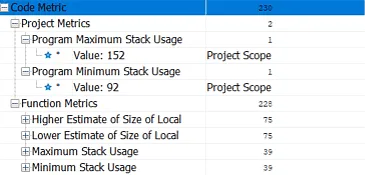
Stack analysis metrics displayed in the Polyspace desktop interface.
To investigate excessive stack usage, developers can run Polyspace locally, inspect call depths to identify root causes, and reduce stack usage by optimizing resource use.
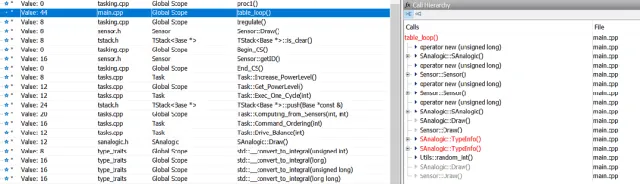
Call tree and higher stack estimate for function table_loop().
Monitoring stack analysis throughout development
Polyspace Access is a results database server that renders a graphical interface in a web browser. A CI process can trigger stack analysis on a Polyspace Server and upload results to the database. QA and product owners can continuously view stack usage via the web frontend and take action when available stack resources are being overused.
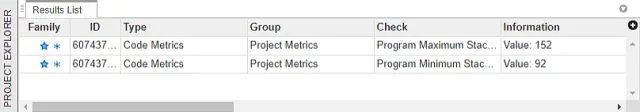
Project-level stack estimates in Polyspace Access.
Next steps include reviewing functions with high stack usage and assigning them to developers for further investigation and debugging. Polyspace allows assigning statuses and severities to analysis results, adding annotations, and exporting issues to bug-tracking tools for developer assignment.
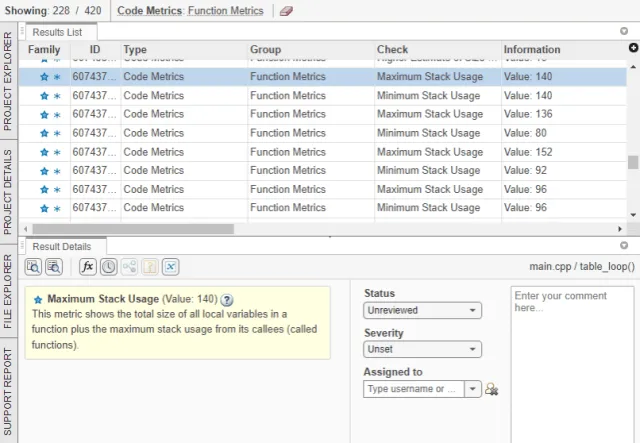
Function-level stack estimates and result review dashboard in Polyspace Access.
Best practices to minimize stack usage
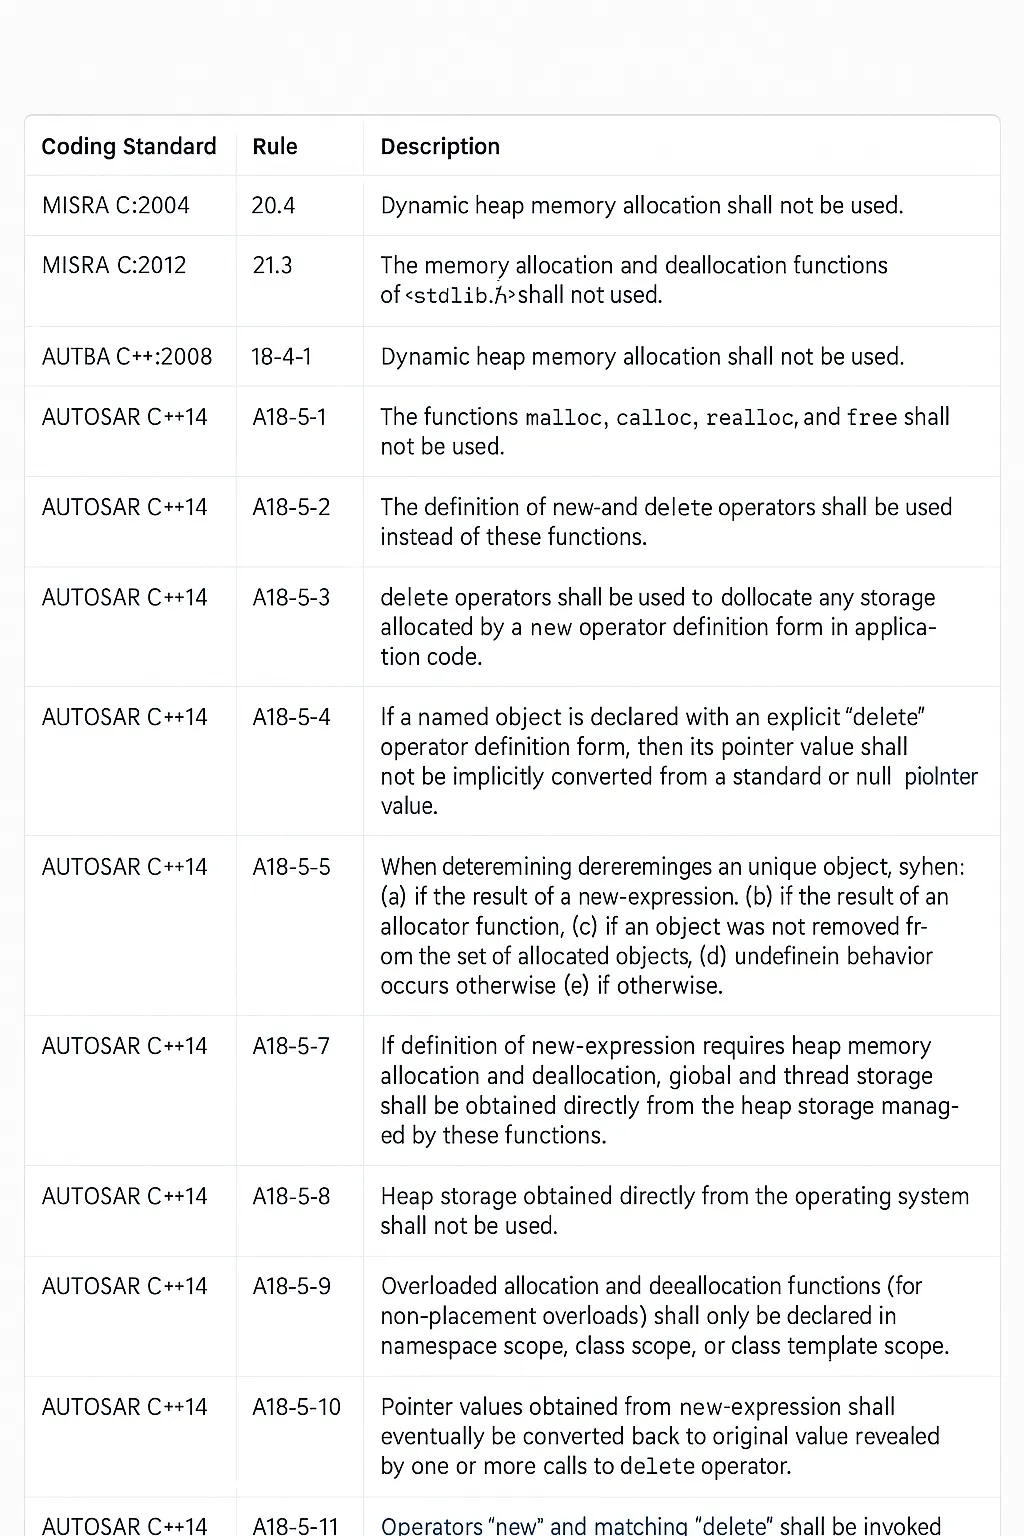
For product-level code, avoid violations of coding standards such as MISRA C, MISRA C++, and AUTOSAR C++. These standards restrict dynamic memory allocation and recommend patterns to optimize static memory use. Polyspace Bug Finder helps identify violations of best practices; developers can monitor these locally while product owners track them via Polyspace Access. The following practices and rules explain best approaches for static memory allocation, which can be analyzed with Polyspace Bug Finder.
Stack usage tends to increase with code cyclomatic complexity, nested call depth, and number of variables in functions. Polyspace can monitor variables that influence stack usage and supports setting code complexity thresholds.
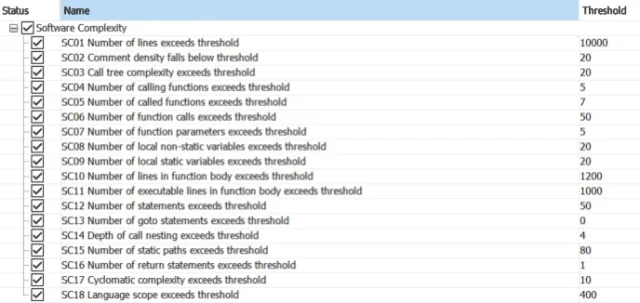
Setting code complexity thresholds.
Polyspace Bug Finder provides runtime checks for static and dynamic memory allocation. Addressing defects across priority levels reduces the risks associated with memory allocation.
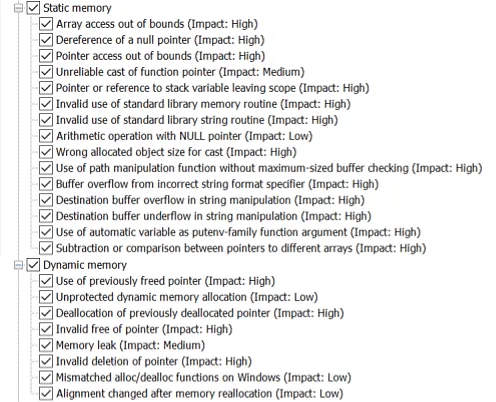
Runtime checks for static and dynamic memory usage.
Regardless of the method used to compute stack usage, allocating a modest safety margin for stack size is often prudent. This helps avoid system vulnerabilities caused by stack overflow scenarios that might not be detected during testing.
Stack overflow vulnerabilities are a common cause of undefined behavior in deployed embedded applications. Using appropriate tools at the right times and following best practices increases confidence that the software will resist stack overflows.