ALLPCB


Introduction
Medical and fitness applications and their associated electronic devices are evolving rapidly. Demand in the healthcare device market is large and diverse. Instruments once restricted to hospitals are now used for home healthcare and personal health monitoring.
Consumer products commonly include devices that measure heart rate and blood oxygen levels. A pulse oximeter can perform both measurements. This device appears in two common forms on the market: a standalone home medical device and a module integrated into wrist-worn fitness trackers.
This article explains the basics of pulse oximetry for medical and fitness uses and presents a reference design that describes methods to measure heart rate and blood oxygen saturation.
What is oximetry?
Oximetry measures blood oxygen saturation, usually expressed as a percentage. A pulse oximeter is a noninvasive device used to measure a person's blood oxygen saturation and heart rate. The device is typically recognized by a clamp-style probe that is placed on a patient’s finger.
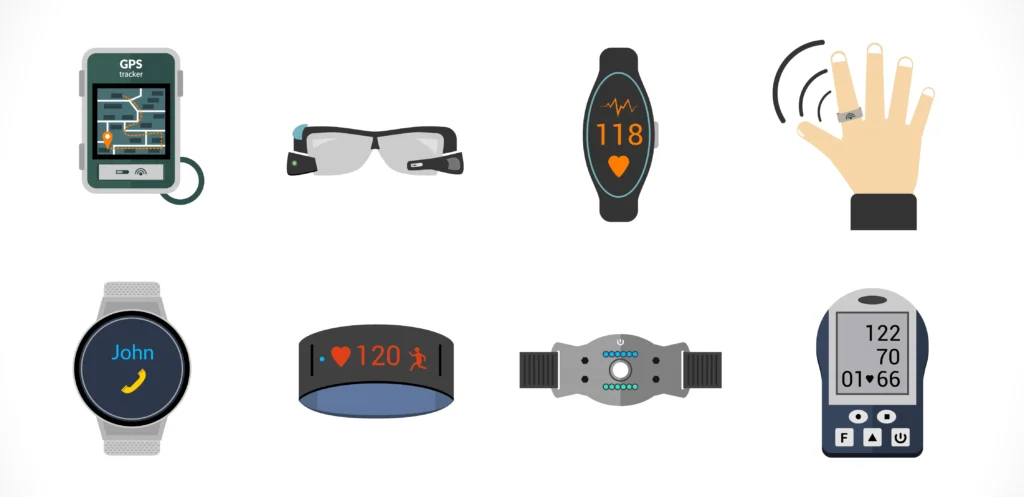
Pulse oximeters can be standalone devices, part of patient monitoring systems, or integrated into wearable fitness trackers. Typical users include hospital nurses, outpatients at home, fitness center users, and personnel working in low-pressure environments such as pilots.
What is oxygen saturation (SpO2)?
Oxygen saturation is derived from hemoglobin, the pigment in red blood cells that carries oxygen and gives blood its red color. Hemoglobin exists in two forms. Oxyhemoglobin, represented as HbO2, is the oxygenated form. Deoxyhemoglobin, represented as Hb, is the deoxygenated form.
SpO2 is the ratio of oxyhemoglobin to total hemoglobin and is expressed as a percentage. Normal readings are typically 97% or higher.
How do pulse oximeters measure SpO2?
Hemoglobin absorbs and reflects light differently depending on its oxygenation state. Deoxyhemoglobin absorbs more visible red light, while oxyhemoglobin absorbs more infrared light. Because SpO2 can be determined by comparing Hb and HbO2 values, one measurement method alternately transmits red and infrared LED light through a body part, such as a finger or wrist, and compares the relative intensities of the two wavelengths.
There are two common measurement approaches: transmission oximetry, which measures light transmitted through tissue, and reflection oximetry, which measures light reflected from tissue.
Hospitals generally use transmission oximetry. Most patient monitors used in clinical settings use transmission-style pulse oximeters, while many advanced wearable fitness devices use reflection-style pulse oximetry.
How do pulse oximeters measure heart rate?
Each heartbeat pumps blood through capillaries, slightly increasing capillary volume during systole and decreasing it during diastole. These small volume changes modulate the amount of light transmitted through or reflected from the tissue for both red and infrared wavelengths. Although the fluctuation is small, a pulse oximeter can detect it using the same optical hardware used for SpO2 measurement, and derive heart rate from the pulsatile signal.
Operating principle
A typical pulse oximeter monitors SpO2 using the distinct absorption characteristics of oxyhemoglobin (HbO2) and deoxyhemoglobin (Hb) for red light (600–750 nm) and infrared light (850–1000 nm). The device alternately emits red and infrared light through a body part, such as a finger, to a photodiode sensor.
The photodiode receives the unabsorbed light from each LED. The resulting signal is inverted by a reverse operational amplifier stage. The processed signal represents the light absorbed by the finger.
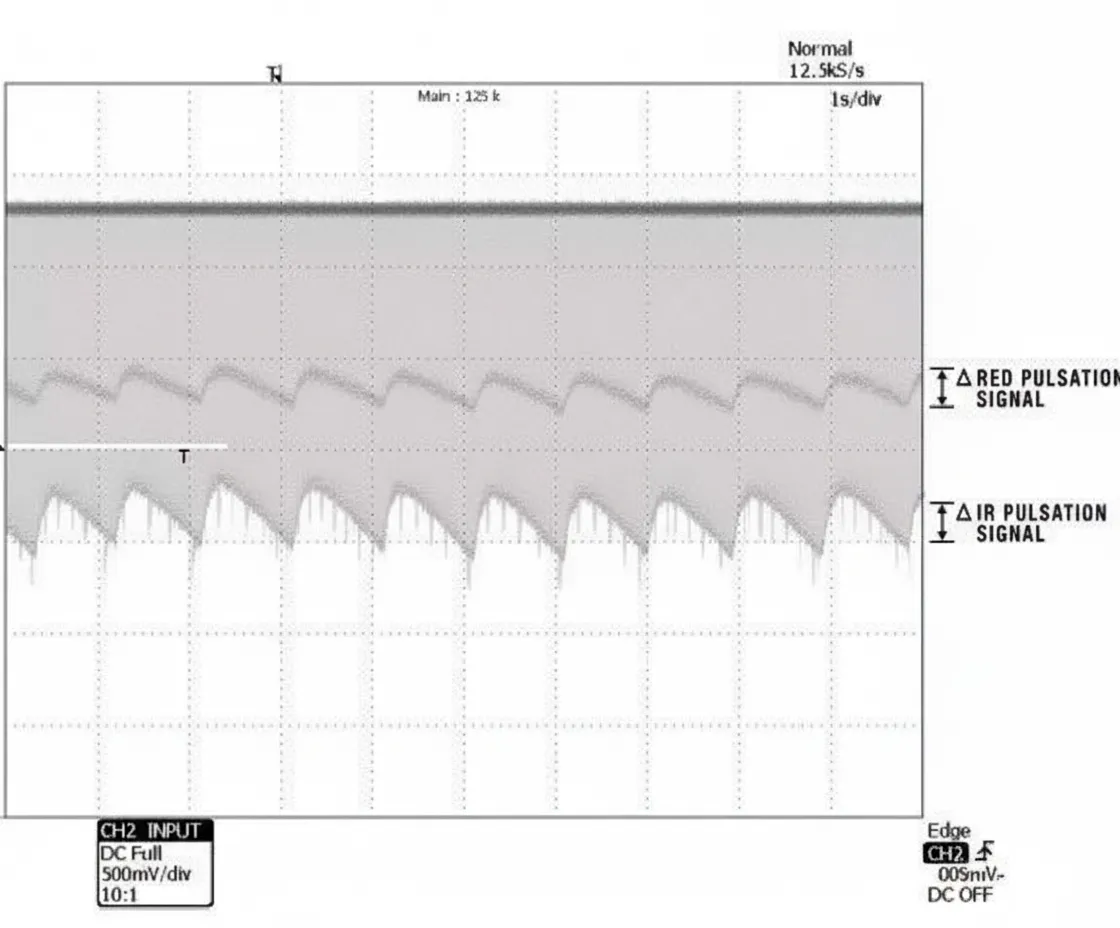
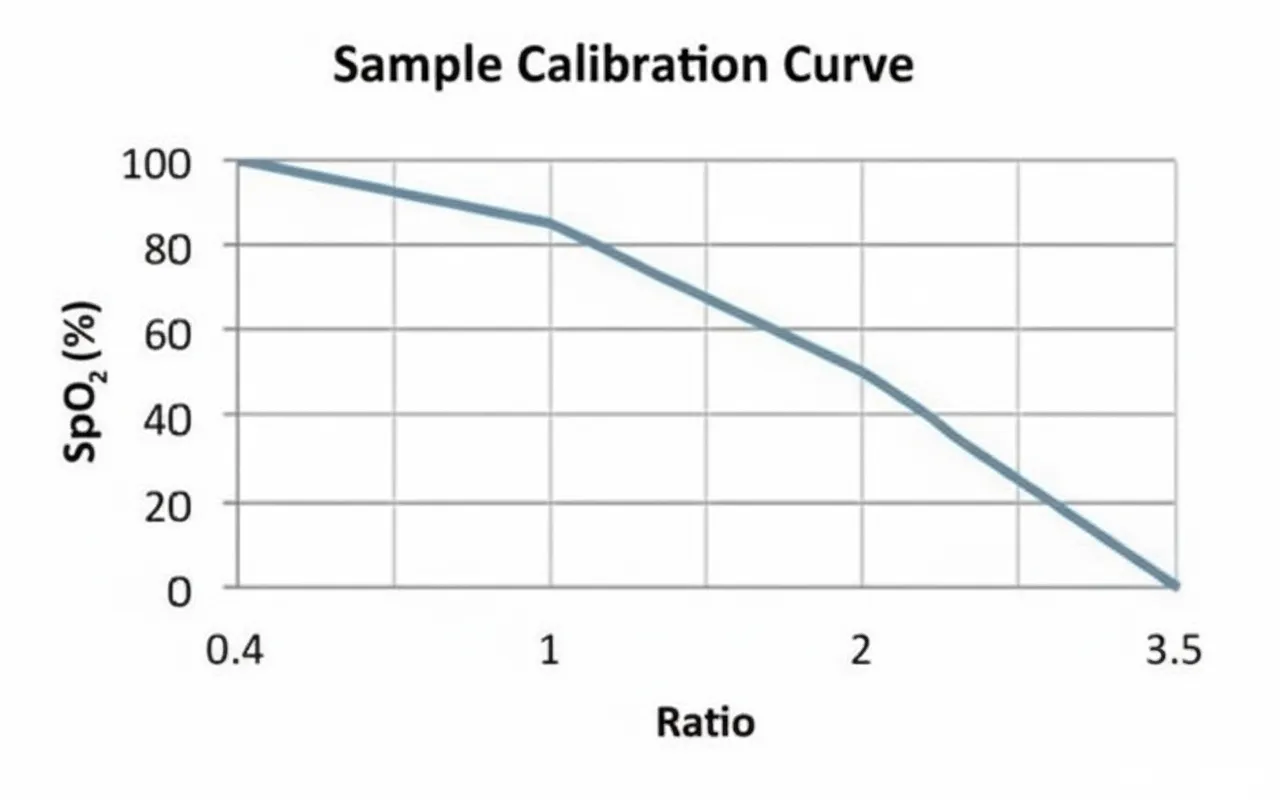
The pulse amplitudes (Vpp) of the red and infrared signals are measured and converted to Vrms values to compute a ratio R. SpO2 is then determined from this ratio using an empirical lookup table derived from calibration data. Heart rate can be calculated from ADC sample counts and sampling rate.
Lookup tables are an essential component of pulse oximeters. The lookup table corresponds to the specific oximeter design and is typically based on calibration curves obtained from many subjects measured at different SpO2 levels.
Circuit design overview
The following example details the parts of a transmission pulse oximeter design.
Probe
The example uses an off-the-shelf finger clamp probe that integrates a red LED, an infrared LED, and a photodiode. These LEDs are controlled by LED driver circuitry.
The conditioned signals from the photodiode are fed into a 12-bit ADC module integrated into a digital signal controller (DSC) to compute the SpO2 percentage.
LED drive circuit
Two PWM signals from the DSC drive a dual-channel single-pole double-throw analog switch that alternately switches the red LED and the infrared LED. To obtain sufficient ADC samples and allow enough processing time before the next LED pulse, the LEDs are controlled according to the timing diagram.
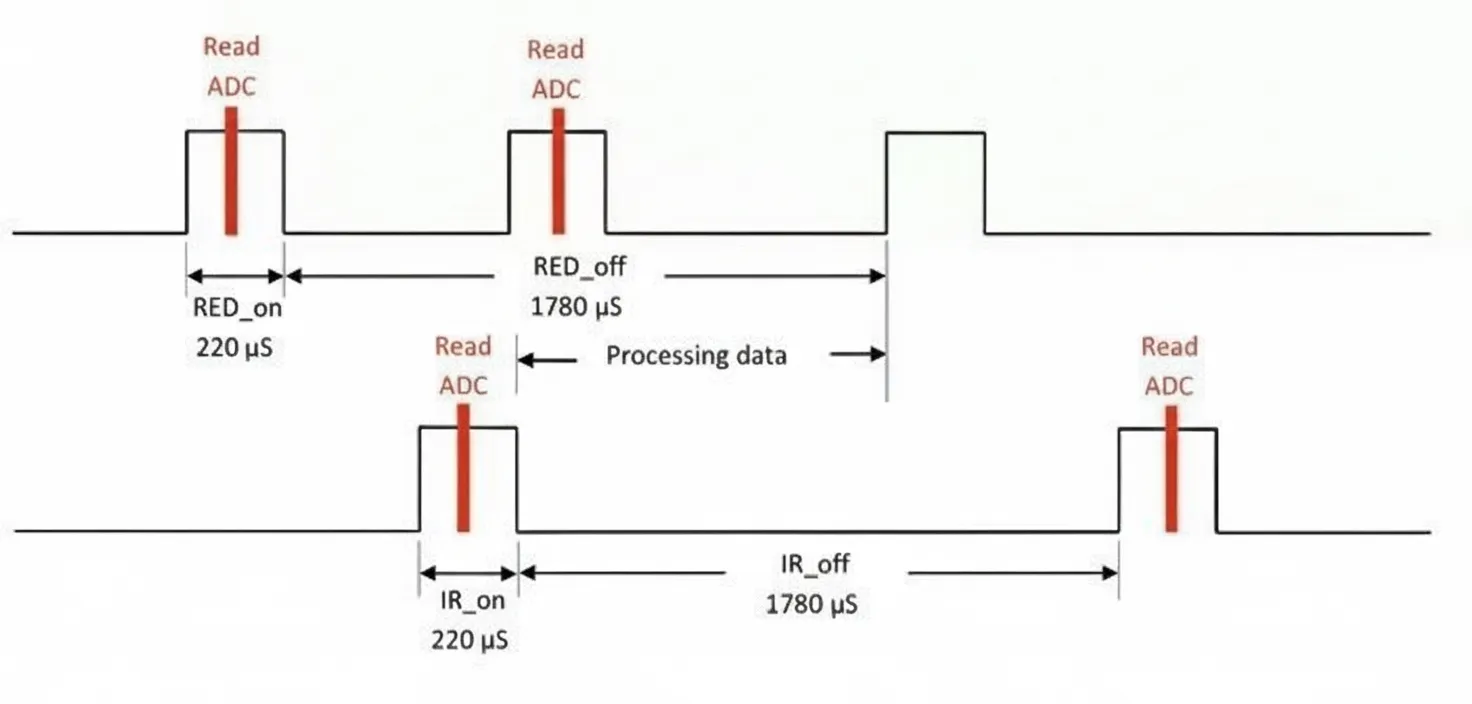
LED current/intensity is controlled by a 12-bit DAC driven by the DSC.
Analog signal conditioning
The analog signal conditioning circuit contains two stages. The first stage is a transimpedance amplifier that converts the photodiode current of a few microamperes into a voltage of a few millivolts. A high-pass filter is placed between the two stages to reduce ambient light interference.
The high-pass filter output is then sent to a second-stage amplifier with a gain of 22 and a DC offset of 220 mV. The amplifier gain and DC offset should be set so the amplifier output stays within the ADC input range of the MCU.
Digital filter design
The conditioned analog output is connected to the DSC's integrated 12-bit ADC. In this example, a dsPIC33FJ128GP802 DSC is used to take advantage of its DSP capabilities and to use Microchip's digital filter design tools.
An ADC sample is taken during each LED on period and also during each LED off period. Because direct measurement of light through tissue is challenging, a 513-tap FIR bandpass digital filter is used to filter the ADC data. The filtered data are then used to compute pulse amplitudes.
FIR bandpass filter specifications:
- Sampling frequency: 500 Hz
- Passband ripple: 0.1 dB
- Passband frequencies: 1 Hz and 5 Hz
- Stopband ripple: 50 dB
- Stopband frequencies: 0.05 Hz and 25 Hz
- Filter length: 513 taps
- Window type: Kaiser
The red trace is the FIR filter input signal. The green trace is the FIR filter output. The X axis is ADC sample index. The Y axis is ADC code value.
Conclusion
The home medical and fitness markets are growing rapidly, and demand for devices that measure heart rate and blood oxygen is expected to increase. Pulse oximeter reference designs, such as the one described here, are useful resources for designers developing medical and fitness devices that measure heart rate and SpO2.