ALLPCB


Challenge
Measure human pulse by sensing impedance changes based on the electrical impedance characteristics of the body. Using LabVIEW and its digital signal processing functions to reconstruct the pulse waveform and extract and store waveform features. After collecting sufficient data, apply the language's numeric and mathematical libraries to perform regression analysis and build models relating pulse signals to cardiovascular conditions.
Solution Overview
Software development used NI LabVIEW 8.5, combined with a custom pulse signal acquisition device, to implement a measurement system that provides signal analysis, processing, display, and regression analysis functions.
Introduction
Worldwide, the number of people with cardiovascular disease continues to increase, and such diseases are a leading cause of death. Reports indicate that millions die annually from cardiovascular causes, with hypertension being a common condition. Health authorities in China reported more than 150 million people with cardiovascular disease, and cardiovascular disease is a major cause of mortality in the Chinese population. Therefore, preventing these conditions is important.
The arterial pulse system is an important component of the cardiovascular system. Extracting physiological and pathological information from the pulse waveform for clinical diagnosis and treatment has attracted medical interest. The waveform morphology, amplitude, rate, and rhythm collectively reflect many hemodynamic characteristics of the cardiovascular system. Traditional Chinese medicine's pulse diagnosis theory holds that pulse wave propagation is closely related to blood motion and blood vessel wall dynamics.
Pulse Signal Formation Mechanism
Blood circulates in a closed loop formed by the cardiovascular system. The heart drives circulation by orderly contraction and relaxation, ejecting blood into the arteries. Each heartbeat produces a periodic pressure fluctuation in the arteries, causing the arterial wall to oscillate; this oscillation is the pulse. The pulse can propagate along the arterial wall toward peripheral vessels; this spatial propagation is the pulse wave.
Impedance Measurement Principle
Bioimpedance measurement is a technique that uses the electrical properties of biological tissues and their changes to extract biomedical information related to physiological and pathological states. It typically applies a small AC measurement current or voltage via electrodes on the body surface, measures the resulting impedance and its changes, and then derives physiological information for specific applications.
Model the measured body part (in this design, the forearm) as a uniform cylindrical conductor with blood vessels at the center.
By definition, a conductor's resistance R depends on resistivity, length, and cross-sectional area:
R = ρL/S = ρL2 /V
where ρ is resistivity, S is cross-sectional area, L is length, and V is volume. Assuming the cylinder length is constant, the relationship between resistance change ΔR and volume change ΔV is:
ΔR = - ρL2ΔV/V2 = - RΔV/V
This relation shows that volume changes are closely related to resistance changes; the negative sign indicates that an increase in volume reduces resistance. Thus, the measured body part behaves as a resistor with periodic resistance changes; measuring the resistance change waveform yields the pulse signal. By injecting an excitation current and converting impedance changes to a voltage signal, the periodic voltage variation can be measured to reflect impedance changes and obtain the pulse waveform.
Pulse Signal Acquisition Design Considerations
Pulse signals share characteristics with other biosignals: they are weak, low frequency, and highly susceptible to interference. If the equivalent impedance of the measured body part is about 1000 ohms, the impedance change from a pulse might be around 1 ohm. The magnitude of this change depends on measurement location, individual differences, and electrode configuration, making direct measurement challenging. In addition to the pulse signal, other biological signals with similar frequency and amplitude characteristics and external interference such as mains hum and lighting can significantly affect high-quality pulse extraction.
Using virtual instrumentation to analyze biosignals can reduce signal processing complexity and address many of the issues above, making physiological signal processing more convenient. Given LabVIEW's digital signal processing and mathematical analysis capabilities, LabVIEW was used to implement the pulse detection and analysis software.
Extraction is based on modulation and demodulation. The overall system block diagram is shown in Figure 2. In this design the measurement location is the forearm. Excitation electrodes (E1, E4) inject a 100 kHz, 0.6 mA carrier into the body. With E1 and E4 spaced 15 cm apart, the equivalent impedance under this high-frequency excitation is about 200 ohms. The pulse signal is therefore amplitude-modulated onto the carrier. The modulated signal is picked up by measurement electrodes (E2, E3) and fed to the pulse conditioning circuit for analog demodulation to remove the high-frequency carrier and recover the pulse wave. At the same time, sampling points before analog demodulation are sampled at high speed and sent via serial port to LabVIEW, where software performs demodulation, signal processing, feature extraction, waveform display, and regression analysis.
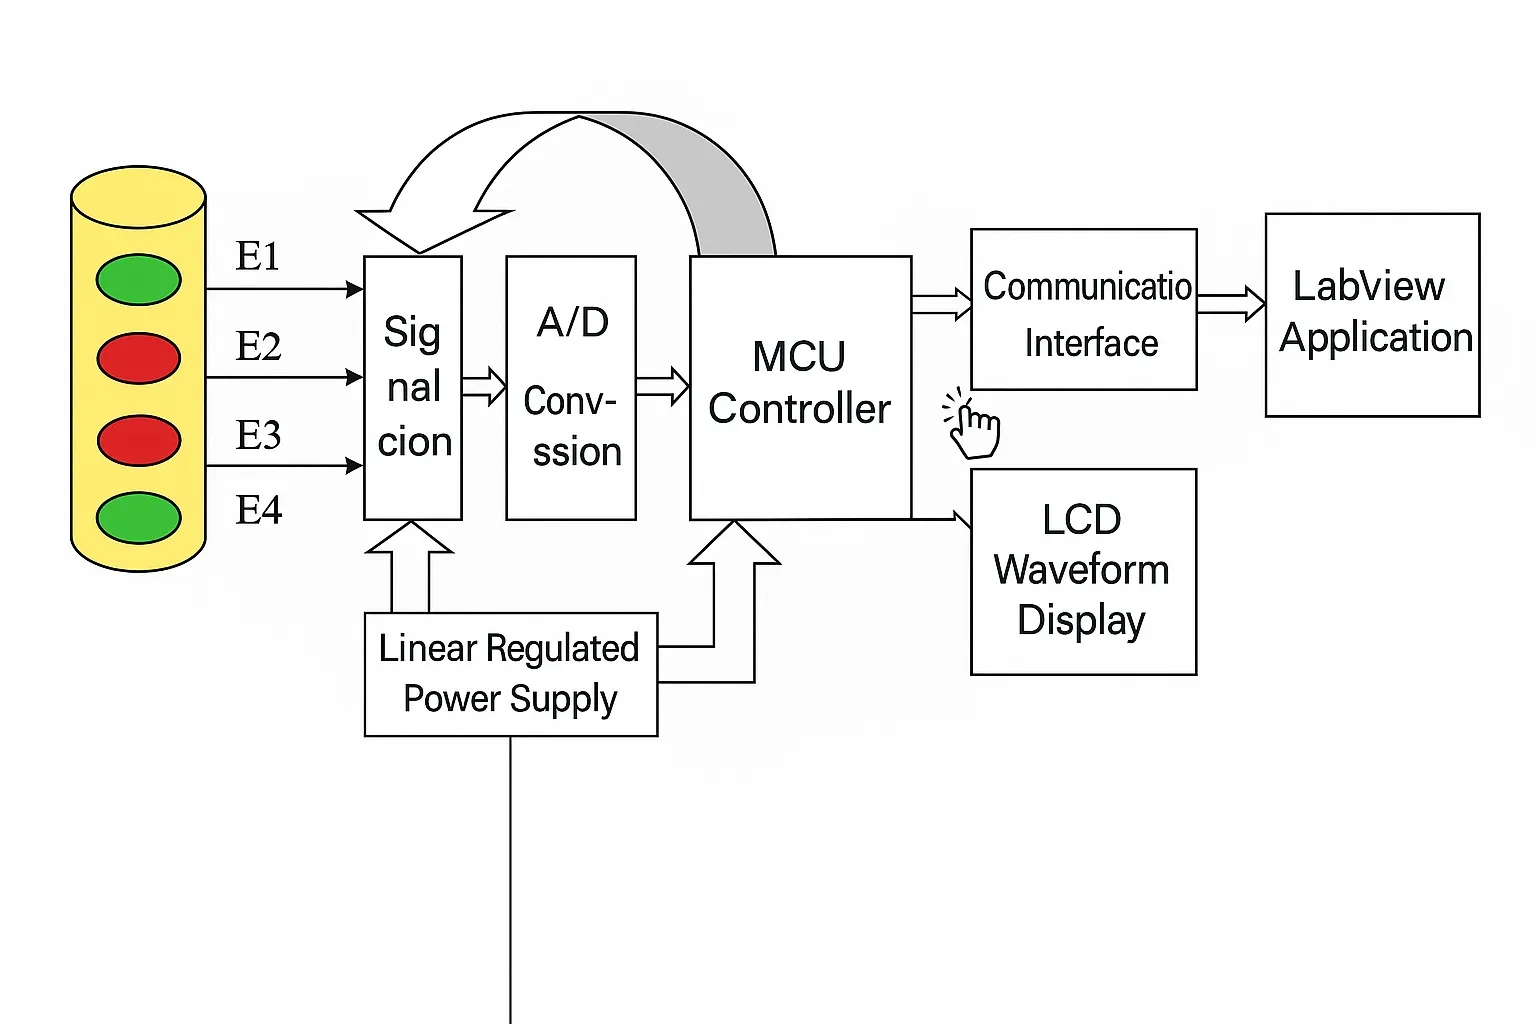
Figure 2 System block diagram
LabVIEW Program Design
To reduce external interference and minimize distortion introduced by analog circuits, the system uses virtual instrumentation for software-based processing. To isolate computer ground noise from the microcontroller ground, a 6N137 optocoupler is used to prevent noise coupling into the signal conditioning circuit, improving the system's interference immunity.
The system includes a personal information entry module to record age, sex, weight, height, hypertension status, and blood pressure values, as shown in Figure 3.
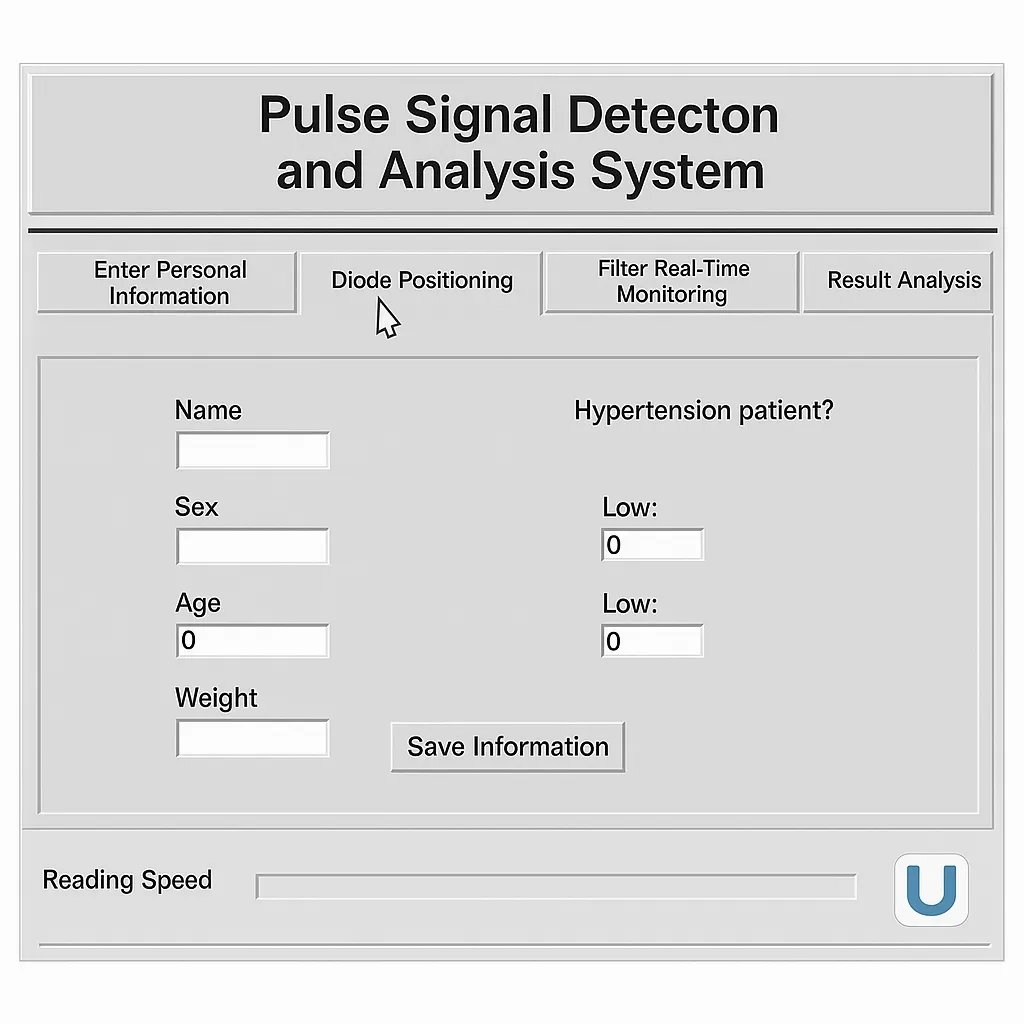
Figure 3 Personal information entry interface
Data received via the serial port are synchronously demodulated. To preserve waveform fidelity, a maximally flat Butterworth filter is used for filtering. Peak detection, differentiation, and other methods extract waveform features. The real-time waveform display module shows the waveform and heart rate, and can trigger an alarm if heart rate is outside normal range. Waveform data can be stored for further analysis. Since emotional state or slight body movement affects the signal, measurements should be taken when the subject is calm.
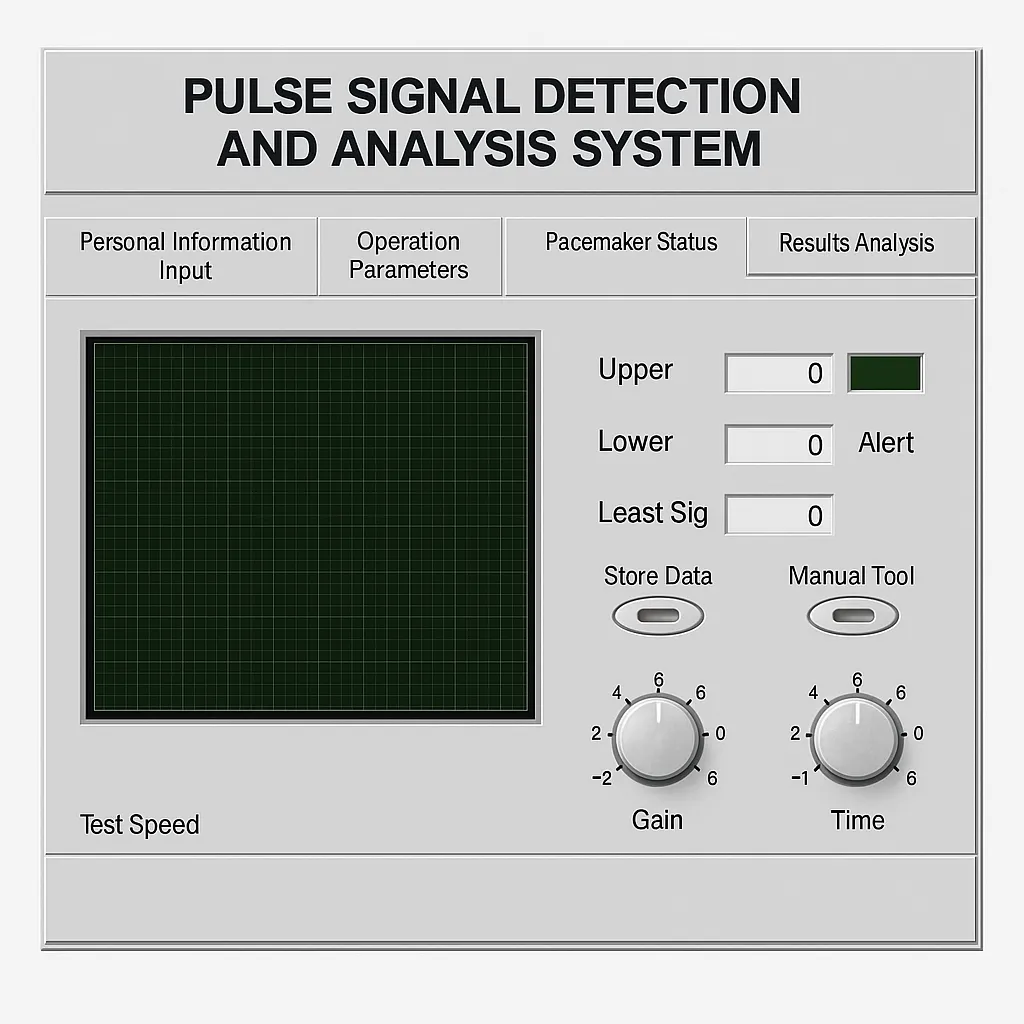
Figure 4 Real-time waveform display interface
LabVIEW's math and signal processing libraries provide tools for complex numerical analysis, mathematical computation, and signal processing, allowing users to implement custom algorithms that traditional instruments cannot easily provide. Regression analysis is used to study relationships between variables. After collecting sufficient human-subject data, the results analysis module lets users select independent variables and dependent variables (such as primary wave amplitude, reflected wave amplitude, primary-to-reflected amplitude ratio, rising edge slope) and the number of independent variables. The workflow includes removing outliers, configuring curve fitting, displaying the fitted curve, and obtaining regression coefficients to establish regression equations. Accumulating enough data enables study of waveform differences between healthy subjects and hypertensive patients and the waveform evolution with disease severity.
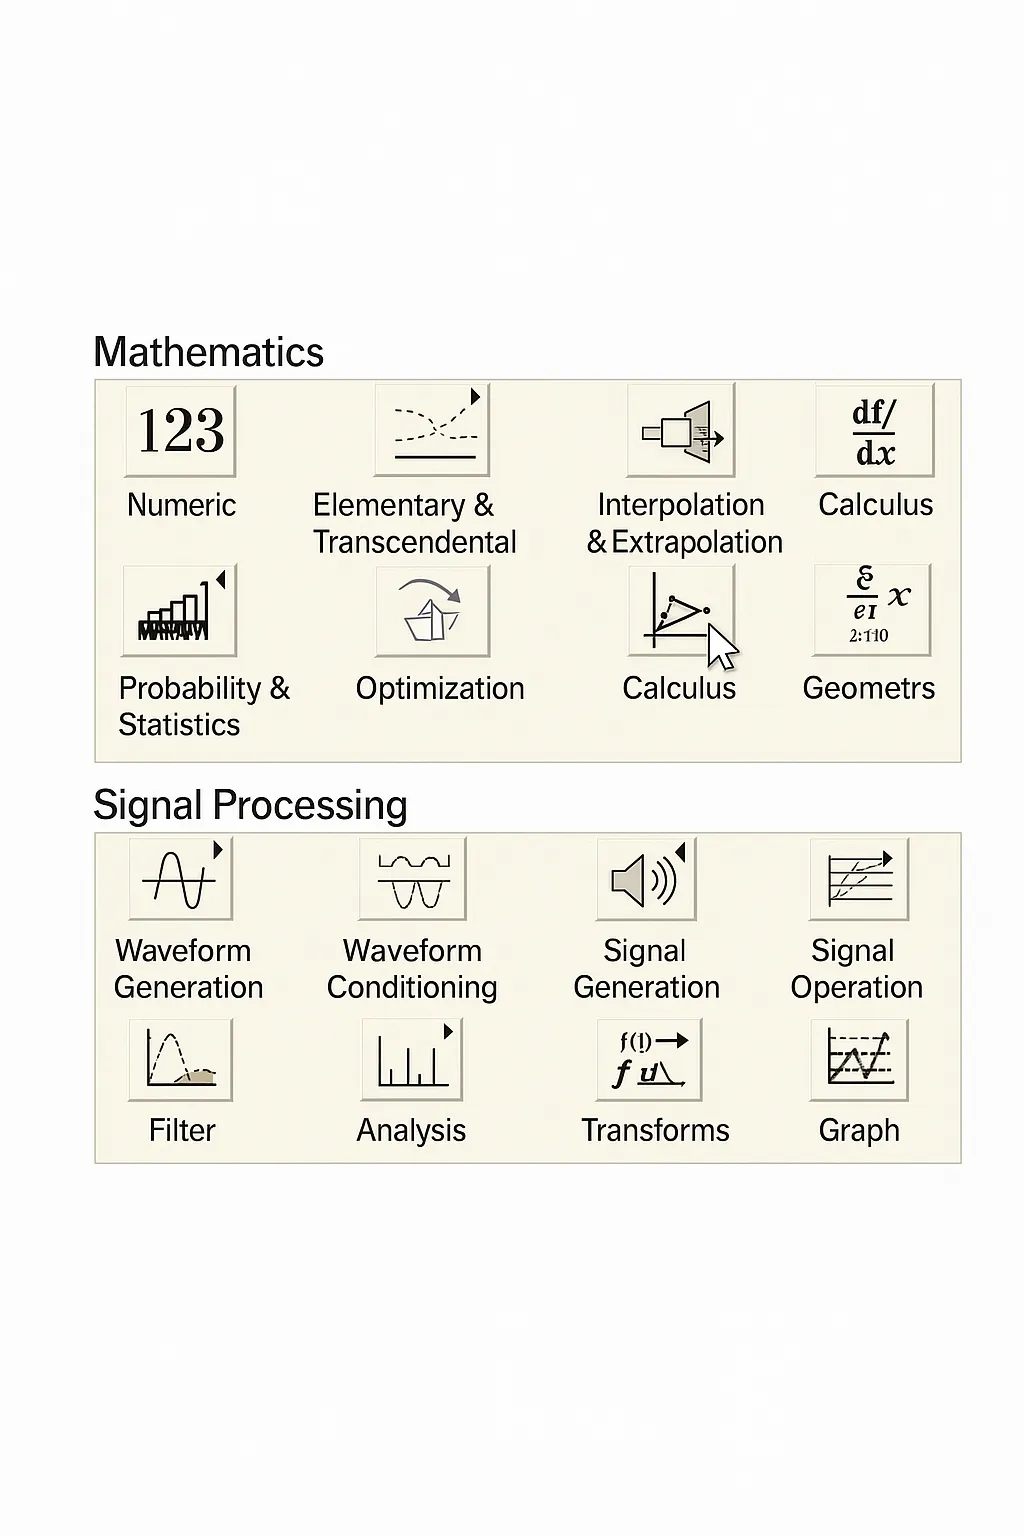
Figure 5 Math and signal processing libraries
System Workflow
To measure pulse signals with this system, follow these steps:
- Choose the measurement location and attach electrodes.
- Enter personal information and configure the serial port.
- Power on the system. The subject should remain still; once the waveform is stable, proceed with data operations.
Conclusion
Based on a custom pulse acquisition device and using virtual instrumentation as the development platform, the system leverages LabVIEW's data acquisition, instrument control, signal analysis, and data processing functions through reusable functional blocks, reducing code development effort and shortening development time. The implemented software successfully extracts and displays pulse signals and provides regression analysis capabilities, forming a foundation for further research and teaching.
System refinement and discovery of underlying patterns require extensive human-subject data; establishing accurate models demands a long-term data collection effort. Ongoing practice will identify additional features and improvements to enhance system performance.