ALLPCB


Introduction
An electrocardiogram (ECG) is a visual time series of cardiac activity and is an important basis for clinicians diagnosing heart disease.
Traditional ECG classification and diagnostic techniques rely largely on manual interpretation. Clinicians use accumulated experience and domain knowledge to reach accurate diagnoses. However, given the high incidence of cardiac conditions and the large daily volume of ECG recordings, fully manual diagnosis is inefficient and can lead to misdiagnoses, which negatively affect patients and healthcare providers. To address these issues, automated ECG classification methods have been developed.
This work designs a hardware ECG data acquisition system based on an STM32 microcontroller for data collection and transmission. The BMD101 chip is used to acquire raw ECG signals, and Bluetooth and WiFi are used to send data to a PC-side application and an Android mobile app for classification processing.

1. Review of ECG Classification Methods
There are two main forms of ECG classification research: shape-based methods and feature-based methods.
Shape-based classification methods require extraction of characteristic waveforms and application of medical classification rules. Philip Deehazal et al. used 12 morphological and interval features to train and test a classifier, dividing heartbeats into five classes with an accuracy of 0.81. Li Kunyang et al. combined wavelet transform and mathematical morphology to detect QRS feature points and obtain parameters such as QRS width and RR interval, then used clinical expert rules to classify beats into four classes with accuracy up to 0.94. Shape-based methods require high-quality ECG signals, have limited noise immunity, and demand precise detection of waveform feature points, making them unsuitable for ambulatory ECG. Consequently, feature vectors extracted by these methods are often insufficient, limiting the number of diagnostic classes and reducing classification accuracy.
Feature-based classification methods are currently the most widely used. Liu Shixiong used wavelet analysis to locate QRS complexes, extracted 26 features from each QRS complex, and used fuzzy clustering for classification. Luo Dehan et al. applied a multi-layer feedforward neural network to achieve six-class ECG classification.
Ji Hu used multiple discriminant analysis and principal component analysis to extract features and then support vector machines for classification. Yusn et al. applied independent component analysis in the time domain to extract ECG features and used a neural network for six-class classification with good results.
Osowski designed a cascaded classifier combining a fuzzy self-organizing layer and a multilayer perceptron to achieve seven-class classification with 96% accuracy. Owis analyzed ECG signals in the Fourier domain to extract features and used nearest-neighbor classification; their experiments reported 100% recognition for five cardiac conditions, while recognition performance for other conditions was lower.
2. Hardware Design
2.1 System Overview
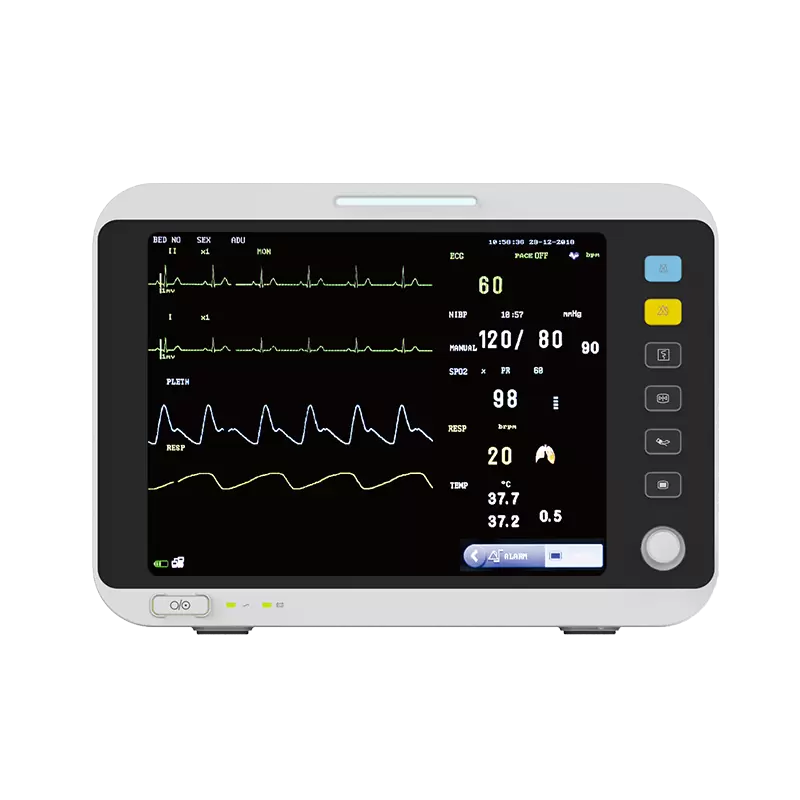
The ECG monitoring system comprises four main modules: ECG data acquisition, wireless transmission, an Android app for data reception and processing, and a PC-side application for data reception and processing.
When a user experiences cardiac discomfort, the device can immediately collect ECG signals. The collected data are transmitted via Bluetooth to the Android app, which can display ECG waveforms and heart rate in real time, determine the user's geographic location, and upload data to a server.
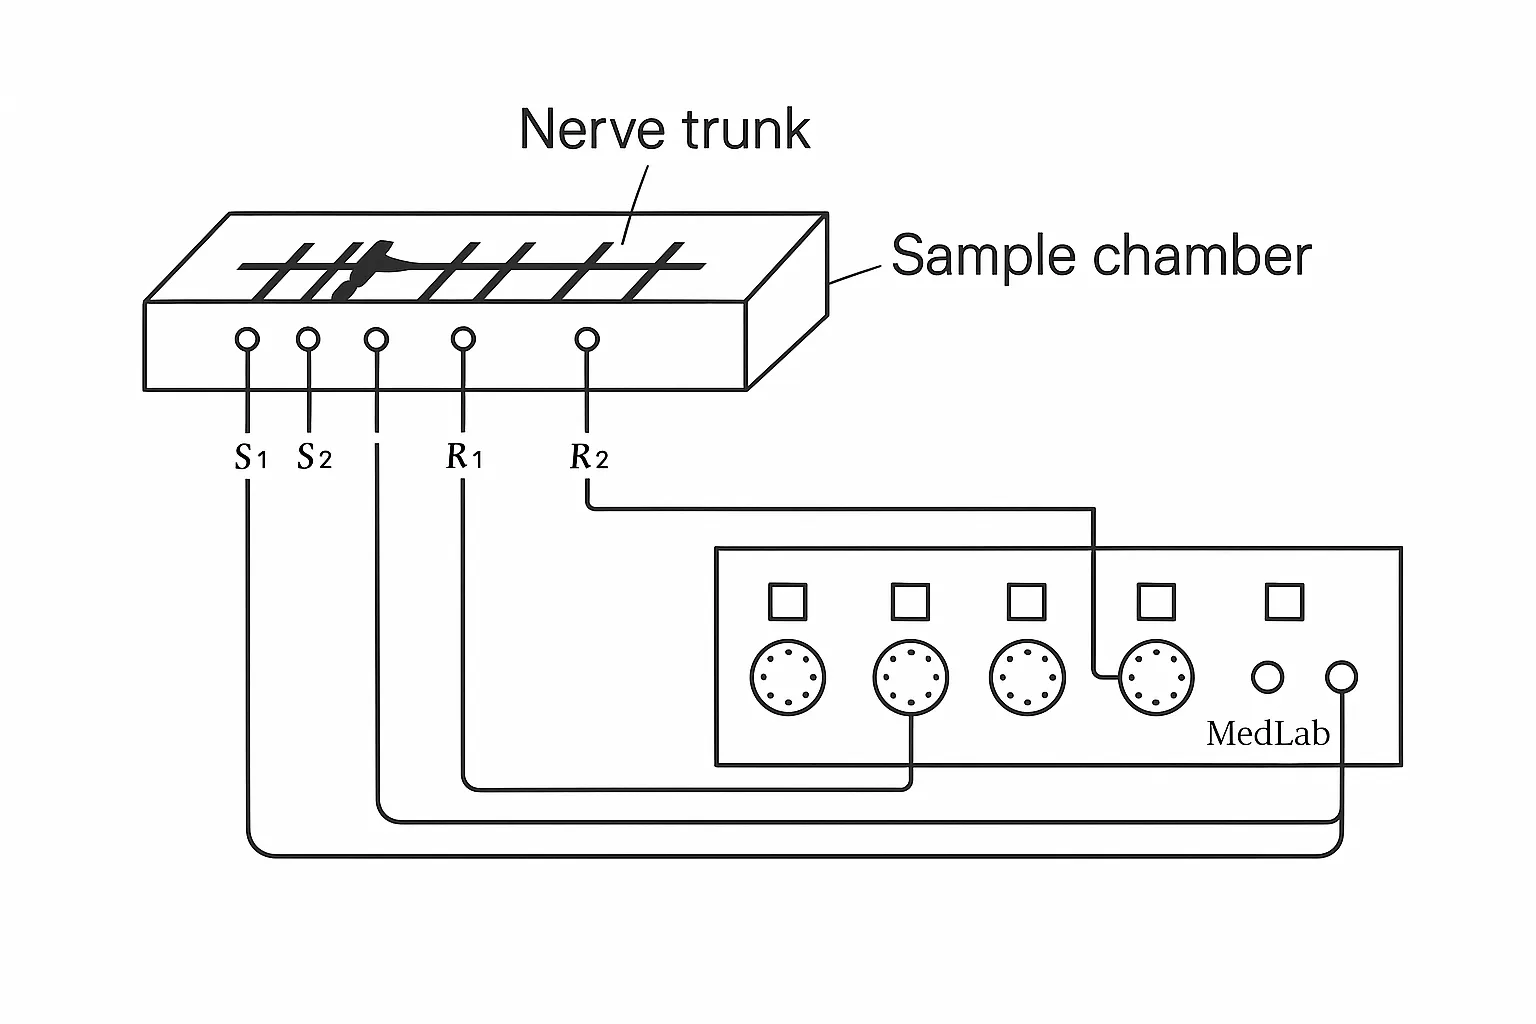
2.2 Acquisition Module
2.2.1 ECG Acquisition Chip
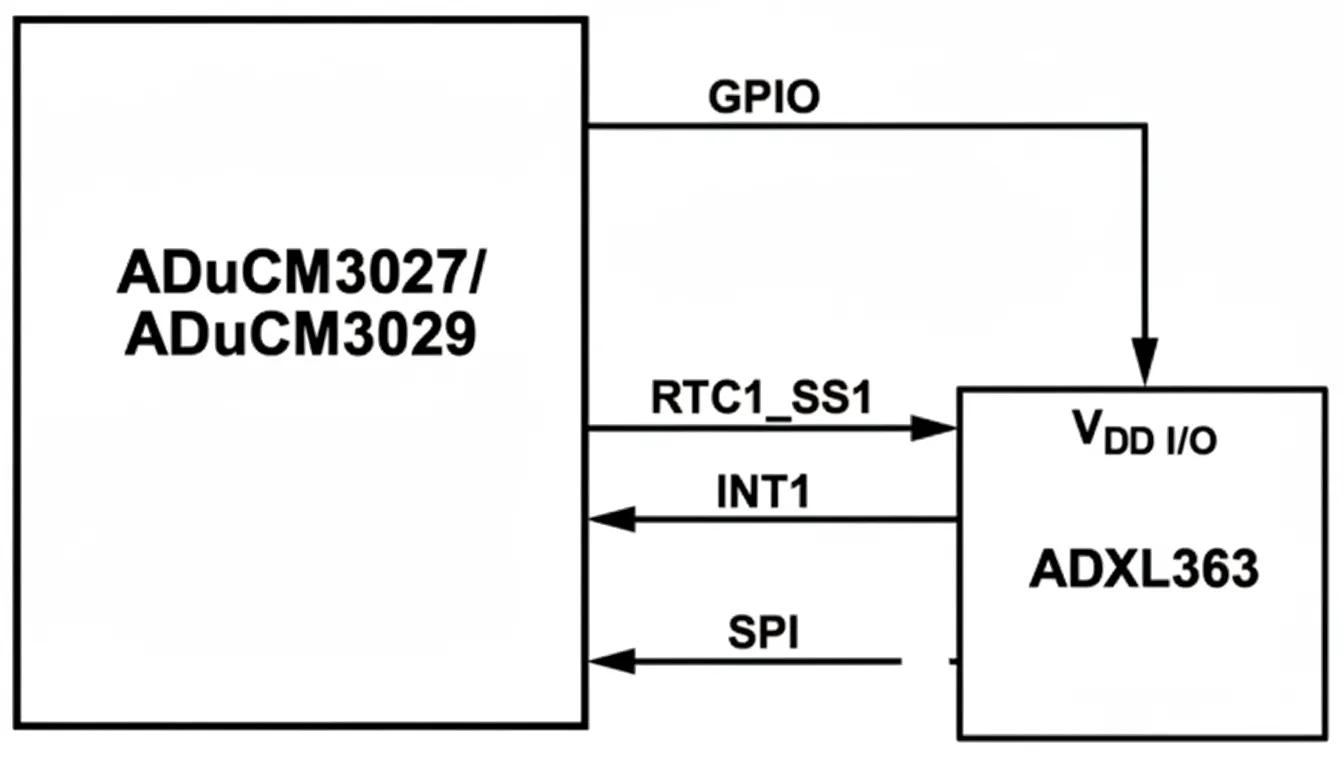
The BMD101 chip features an advanced analog front end and a flexible digital signal processing architecture. It can acquire biopotential signals from microvolts to millivolts and process them using patented algorithms. The core of the BMD101 is a system management unit responsible for system configuration, runtime management, communications, proprietary algorithm computation, and power management. The device also includes a dedicated DSP module to accelerate digital filtering and other computations under the system management unit's control.
3. Classification Algorithms and System Software
This work uses the open-source deep learning framework Faster R-CNN for object detection. Training specific network models under this framework places certain demands on GPU performance: ZF net requires at least 3 GB of GPU memory, and VGG-16 requires at least 8 GB.
3.1 Dataset Construction
Dataset construction includes building the training and testing sets. The training set construction involved extracting 44 sets of human ECG data, R-wave detection, cropping beat images, labeling beats, and augmenting beat images by translation and rotation. The augmented beat image set was used as the training dataset. The test set was built from collected ECG data that underwent preprocessing, R-wave detection, and beat image extraction; the unlabeled beat image set served as the test dataset.
3.1.1 R-wave Detection
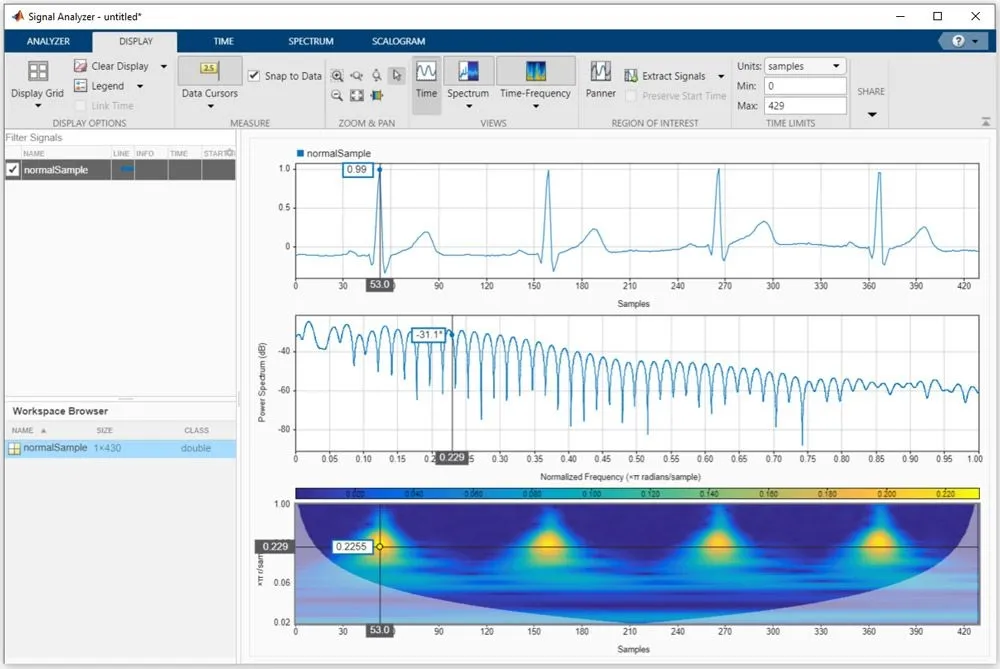
Wavelet transform techniques perform well in improving Q-wave detection accuracy. According to wavelet transform theory, the R-wave peak has a stable displacement relationship with the zero-crossing point between local maxima and minima of the wavelet modulus. Therefore, using wavelet transform to detect QRS complexes locates R waves by detecting the modulus maxima. From the R-peak position, smaller scales are selected and searches are conducted forward and backward to find the start and end of the QRS complex, avoiding distortion of QRS width. For signals with heavy interference or atypical R waves, modulus maxima points are refined to reduce noise influence.
In this experiment, discrete wavelet transform was used to detect R waves. Modulus maxima are first detected, then zero-crossings are found to determine QRS positions. An adaptive noise threshold is introduced to decide whether detected spikes are R waves or artifacts.
3.1.2 Beat Image Extraction
Beat image extraction uses a sliding-window search method. For each R-wave detected by the wavelet method, record the R coordinate, search 250 ms to the left for the left boundary and record it if present; otherwise stop. Then search 250 ms to the right for the right boundary and record it if present; otherwise stop. The segment bounded by these left and right points is cropped as the sample input for the deep learning network.
3.2 Training the Classification Model
In supervised deep learning, labeled datasets are fed into network models according to a strategy. Over thousands of iterations the model adjusts internal parameters and converges to a model capable of effective classification.
In the training dataset saved as XML files, each image is an independent variable xi; the target bounding box coordinates [x1,y1,x2,y2] and the class label Label (Label ∈ {“N”, “S”, “V”, “F”}) are the dependent variable yi. Analogous to fitting a line with many points in two-dimensional space, many (xi, yi) pairs in deep learning can fit a highly complex function determined by model parameters. The essence of a deep learning model is a complex nonlinear function with many parameters that predicts yi given xi.
Within the Faster R-CNN framework, several components must be adapted for training:
- Modify dataset paths, labels, and other hyperparameter files.
- Adjust the number of classes in train_val.prototxt and test.prototxt.
- Modify the solver file and set its path.
- Run the script script_faster_rcnn_VOC2007_ZF.m to start training.
- After training, modify the generated detection_test.prototxt file as needed.
For parameter settings, default values were used except for solver parameters max_iter and stepsize. max_iter denotes the maximum number of training iterations; too small a value leads to undertraining, while too large a value can cause overfitting. stepsize specifies the iteration count for applying learning-rate decay. The learning rate is critical: a larger learning rate is used initially for rapid convergence, and it is reduced later to avoid overshooting optima.
The dataset used contains 800 images. Experiments with different parameter settings found optimal performance with max_iter = 4000 and stepsize = 3000.
4. Classification Results
The Faster R-CNN framework produces three outputs for each detected beat: the bounding box coordinates, the predicted class, and a confidence score between 0 and 1. The bounding box is represented by the coordinates of the top-left and bottom-right corners (a 1×4 vector). The predicted class is one of four discrete values in this study.
For data acquisition and transmission, the STM32-based hardware system with the BMD101 chip collects raw ECG signals and transmits data via Bluetooth and WiFi to the PC-side application and Android app. A PC application was developed to display and save ECG signals, and an Android app provides real-time display, determines the current user location, and uploads ECG data to a remote server.
Accurate ECG classification depends on extracting correct features. This work trains a deep neural network directly on preprocessed ECG signals to extract features layer by layer and fit an automatic ECG classification model. The trained model was tested on ECG data and produced favorable results.