ALLPCB


Introduction
Electronic medical record (EMR) systems combine digital technology, computer technology, communications, software engineering, graphics and image processing, and other multidisciplinary technologies. Their capabilities for complete record keeping, data processing, network transmission, diagnostic support, and statistical analysis are beyond what paper records can provide.
Body temperature is an important data item in an EMR system. For example, a rise in a patient’s temperature indicates fever to clinicians. In the EMR, the temperature chart is primarily used by nurses. Nurses record patients' temperature and other vital signs daily into the database. The system automatically generates an electronic temperature sheet and draws a temperature chart. The chart visually presents the patient’s temperature-related data, which, combined with disease and treatment knowledge, supports diagnosis and treatment decisions.
System Implemented for a Hospital
The EMR system described here was implemented on the .NET platform using C# to meet the requirements of a large hospital. The following sections focus on the design and implementation of the temperature chart component.
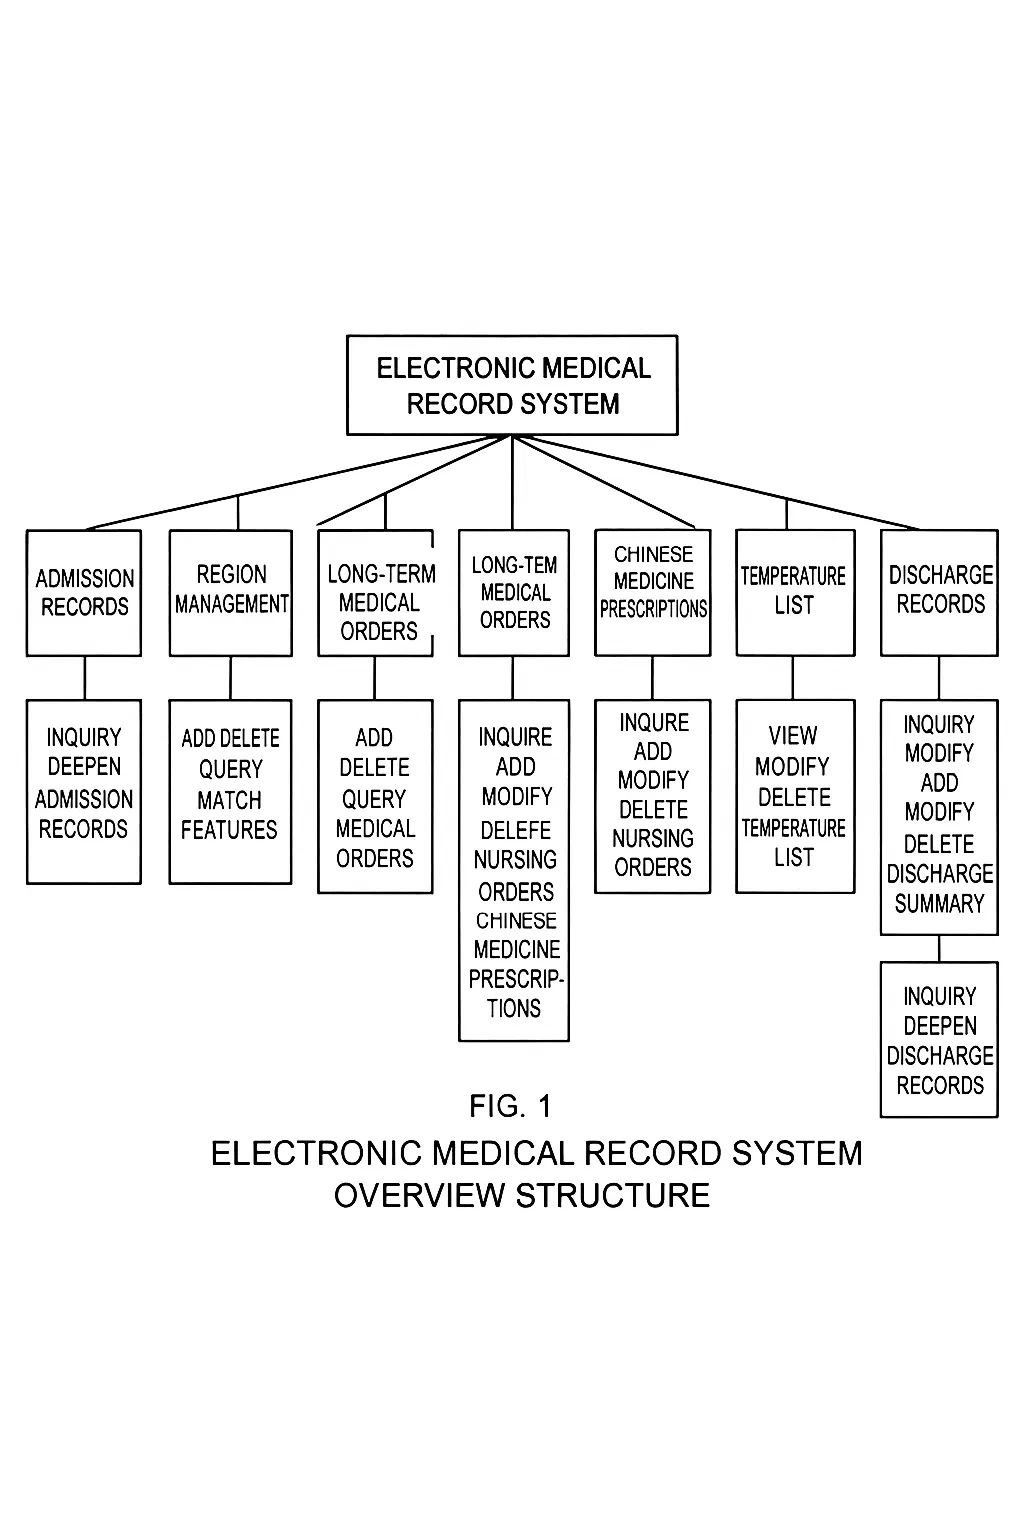
1. EMR System Main Functions
The system’s main goal is to collect patient data to provide diagnostic and decision support for clinicians and to make the data suitable for clinical research. The main functions are summarized in the following diagram.
2. Temperature Chart Design and Implementation
2.1 Generation of the Temperature Sheet
Each patient receives a medical record number during an episode of care. This number uniquely identifies the patient and serves as the key in the database. After admission, nurses record temperature, pulse, respiration, and other observations into the EMR system, which automatically generates the temperature sheet.
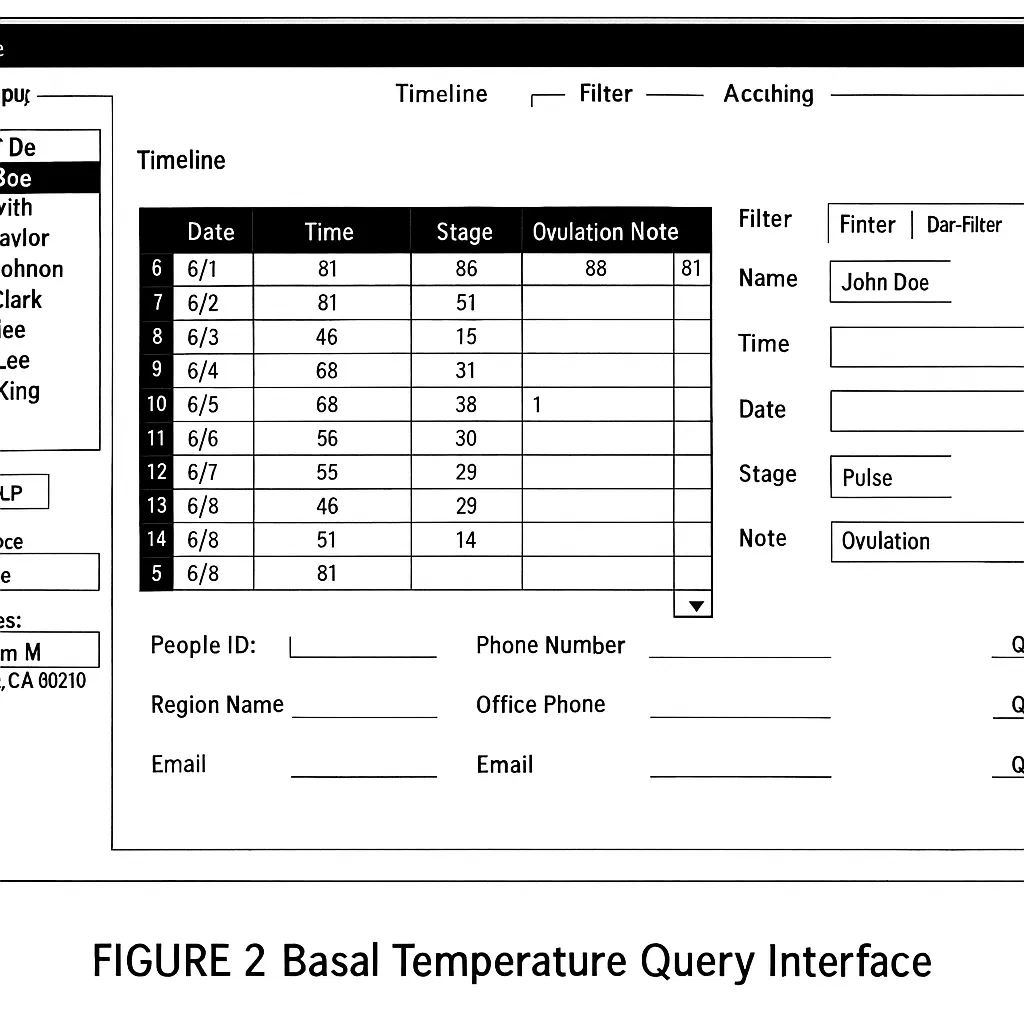
The temperature sheet records and analyzes temperature changes. Temperature, pulse, and respiration are recorded every 4 hours at 04:00, 08:00, 12:00, 16:00, 20:00, and 24:00. Items such as bowel movements, urine frequency or volume, intake, output, blood pressure, and weight are recorded once per day. The temperature chart plots the temperature, pulse, and respiration for each day and also presents the daily-recorded items. Each chart view shows a 7-day interval. Coordinates and curves describe the continuous temperature changes, supporting nurses’ data entry and queries. The temperature sheet interface is shown below.
2.2 Drawing the Temperature Chart
The temperature chart is generated automatically from the temperature sheet data. Because each chart view covers only 7 days, a paging function allows navigation through longer hospital stays by advancing or retreating the 7-day window.
2.2.1 GDI+ Drawing in C#
Chart drawing is implemented with GDI+ from the .NET base class library. These classes perform custom drawing on the screen and send appropriate instructions to the graphics device driver to ensure correct output on the display.
In GDI, device context is represented by the DC object. This object stores information about the specific device and translates GDI API function calls into instructions for that device. Drawing operations use GDI+ techniques and are typically performed by overriding the Form class OnPaint(PaintEventArgs e) method.
Inside OnPaint(), obtain a Graphics object from the PaintEventArgs to draw shapes, then call the base class OnPaint() method. OnPaint() is invoked the first time the window is shown, so drawing code does not need to be duplicated in the constructor.
Because the complete temperature chart is larger than an 800x600 window, scrollbars are required when the document exceeds the window size. Set the document area size to (800,1886) pixels and set the form AutoScroll property to True so scrollbars appear automatically when needed.
2.2.2 Converting Absolute Coordinates to Relative Coordinates
For typical drawing code the drawn area fits within the window, so no special handling is needed. A Graphics instance interprets coordinates relative to the window by default and is unaware of scroll position. When the user scrolls, Windows does not require the application to redraw the currently visible content. Windows moves the display content to match the scrollbar position and raises Paint events for newly exposed areas only. If the application assumes coordinates are relative to the document origin, overlapping or missing drawing can occur when parts of the document were not previously rendered.
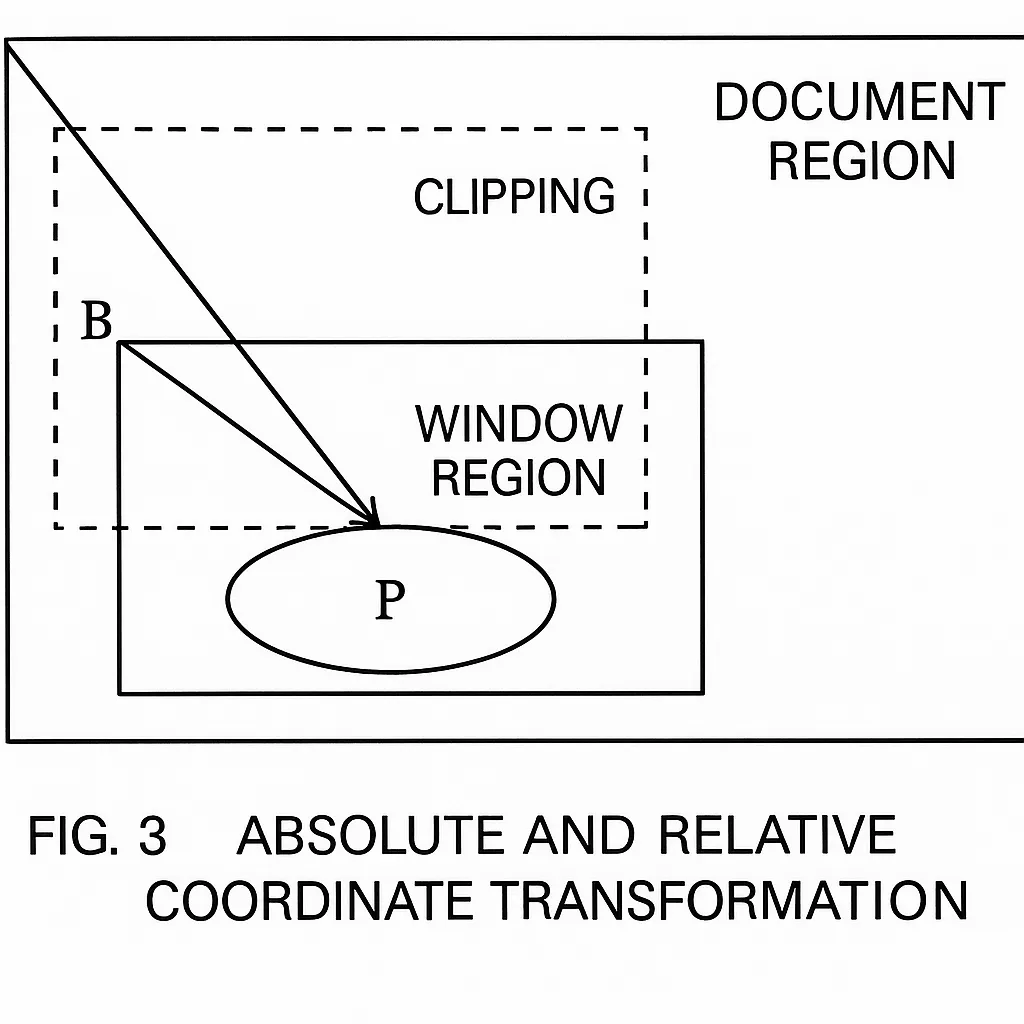
The solution is to convert absolute document coordinates to coordinates relative to the window. Figure 3 illustrates this conversion. The vector from the document origin to the desired point P is known, but the Graphics instance requires the vector from the window origin B to P. The scroll offset vector from A to B is available in the Form property AutoScrollPosition. Subtracting vectors yields the desired B-to-P vector. Graphics.TranslateTransform can be used to apply this offset. Adding the following call in the drawing code resolves coordinate conversion issues:
g.TranslateTransform(this.AutoScrollPosition.X, this.AutoScrollPosition.Y);
2.2.3 Drawing Techniques for the Temperature Chart
Using the patient data from the temperature sheet, C# with GDI+ draws the temperature curves. After converting absolute coordinates to relative coordinates, define pens with the Pen class and brushes with the Brush class. Use brushes to fill regions as needed, and call Graphics.DrawLine to draw line segments, providing the pen and the start and end coordinates for each segment.
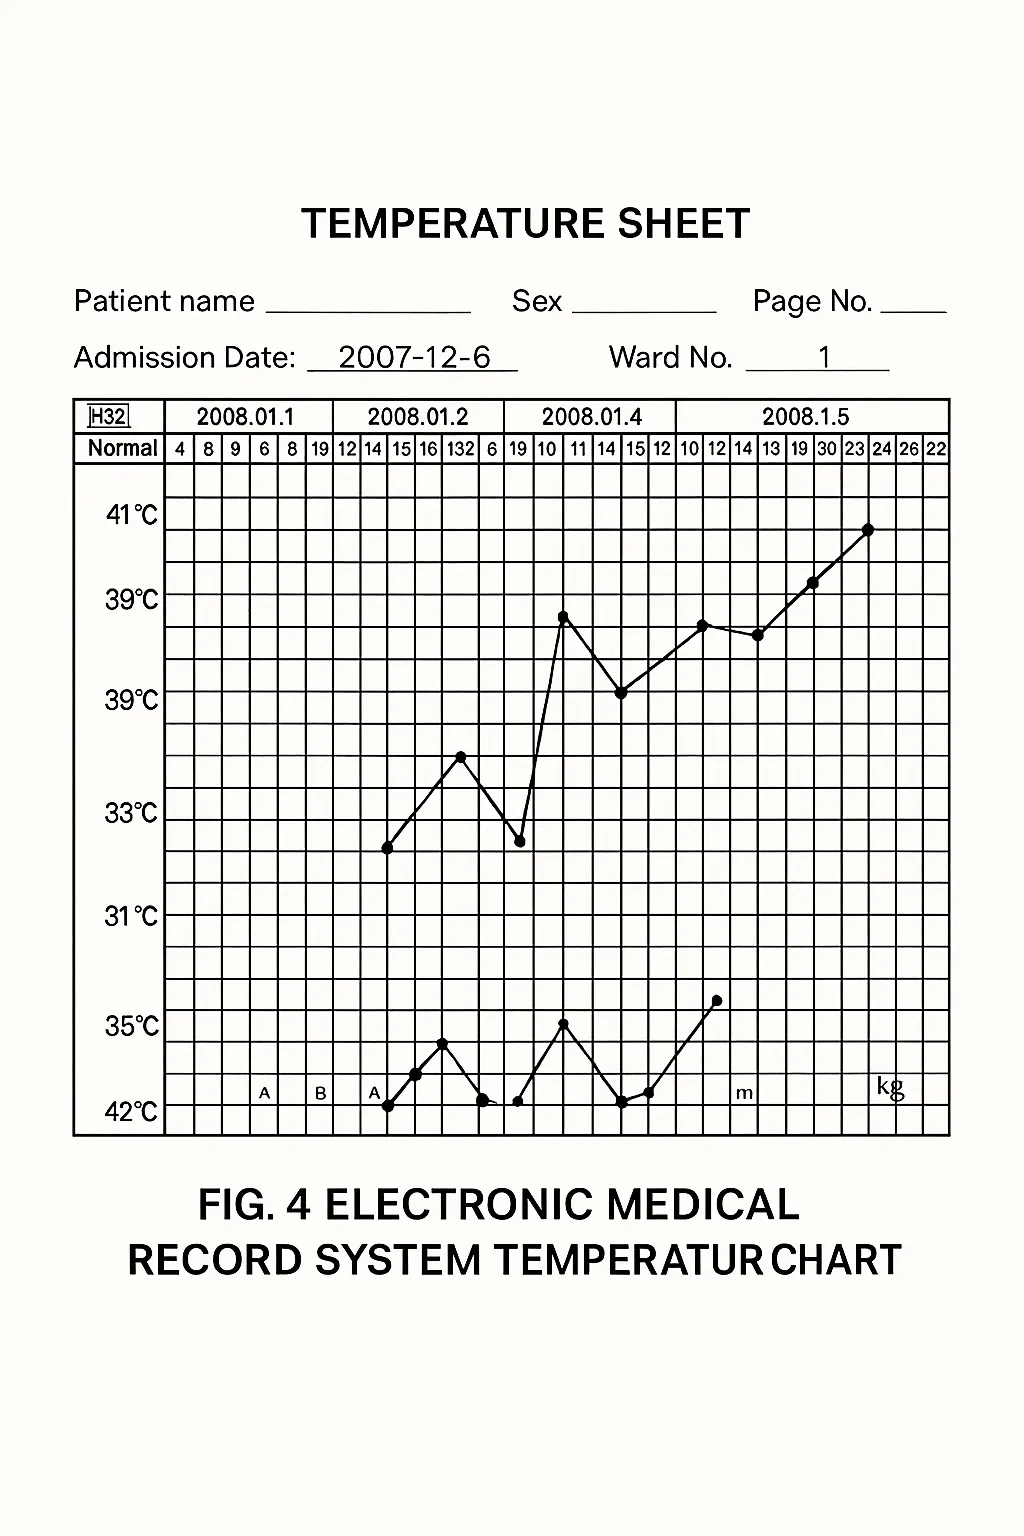
After chart initialization, query the database by the patient identifier from the temperature sheet, convert query results to coordinates, and pass them to drawing methods such as DrawLine and FillEllipse to render the chart. An example chart display is shown below.
2.2.4 Implementing Pagination in the Temperature Chart
Because each chart view covers one week, pagination is used to view earlier weeks. This leverages the Read() method behavior when iterating result sets. Each Read() advances the cursor by one row. Initially, the cursor is positioned before the first row, so the first Read() call advances it to the first row, and subsequent Read() calls advance sequentially. In pagination, a global variable n is controlled by the paging buttons. Compute the number of rows to skip as (n-1)*7, filter the dataset by date accordingly, and store the selected week of dates in an array for rendering.

3 Conclusion
EMR systems are a natural direction for hospital information development. According to HL7 standards, current EMR research in the Chinese market remains incomplete. Developing a robust prototype EMR system suitable for hospital use in the Chinese market requires further research. This article discussed techniques for drawing temperature charts in C# as a contribution toward improving EMR systems. Research on EMR systems will continue to evolve, and their technical architectures and software processes are expected to mature over time.