ALLPCB


Overview
For engineers, using a single instrument to view signals across multiple domains—time, frequency, and modulation—and to analyze several measurement types simultaneously is useful for complex 5G system testing. In 5G systems, digital signals, analog signals, and RF signals interact with one another.
Despite extensive work in 5G system development, researchers and engineers still face many challenges, including:
- eMBB transceiver implementation issues, such as efficient channel coding (LDPC and Polar codes), transceiver energy efficiency, large-FFT OFDM and DFT-s-OFDM, and robust synchronization methods.
- URLLC transport methods used in V2X and remote-control communication, including efficient channel coding, reliable wireless resource access, and transceiver design.
- Transceiver implementation specifics for millimeter-wave communications.
- massive MIMO architectures and algorithms.
- mMTC energy-efficient transmission, synchronization, and multiple access methods for massive machine-type communications, such as IoT.
- mMTC modulation and coding.
- Radio sensing applications within 5G.
- Root-cause relationships among analog, digital, and RF signals.
RF power amplifier timing, gain, and synchronization characteristics must be tested in conjunction with modern control interfaces, such as RF front-end control interfaces (RFFE) like MIPI PI.
Being able to analyze signals across multiple domains is critical for finding interference, glitches, spurs, dropouts, and other faults.
Test Setup
To demonstrate the advantage of multi-domain oscilloscope analysis for RF amplifier performance, a Tektronix MSO6B series oscilloscope was used as the capture hardware.
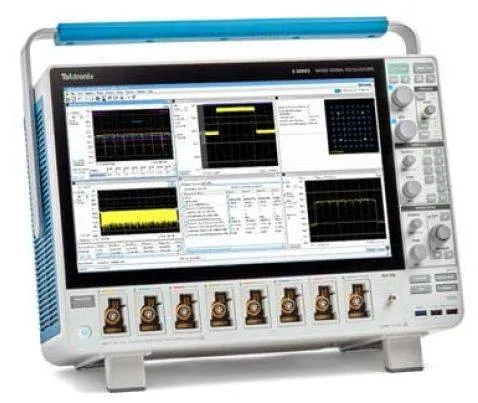
Figure 1. MSO6B oscilloscope running SignalVu-PC software
The device under test is a Mini-Circuits GVA-123+, a compact RF amplifier that illustrates typical measurement issues found in user equipment and base station applications.
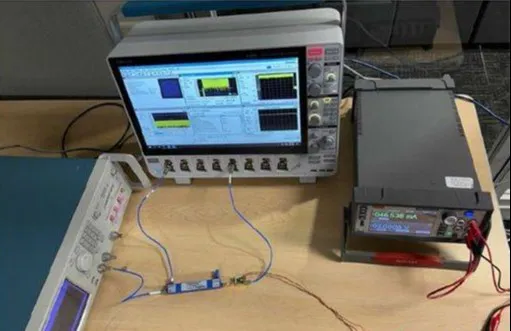
Figure 2. Test equipment: oscilloscope, signal generator, coupler, power supply, and DUT
The Tektronix AWG70000B arbitrary waveform generator was configured as the signal source to generate a single 5G NR carrier at a 3.5 GHz center frequency with 100 MHz bandwidth. The signal was an uplink waveform with 30 kHz subcarrier spacing, 256-QAM, and 11.5 dB OFDM PAPR.
The AWG was set to produce 250 mV to 500 mV peak-to-peak, approximately –11 to –17 dBm synthesized average power.
A coupler (ZDC-10-0123) was used to capture the input signal on oscilloscope channel 1. A Keithley source-measure unit supplied the device under test.
A current probe was added to oscilloscope channel 6 to measure the amplifier current draw.
On the MSO6B, SignalVu VSA software with the 5G NR option was used and configured to analyze the signal captured on oscilloscope channel 1.
Measurement Examples
As an example, the amplifier produced acceptable readings when triggering on the RF input.
Figure 3. Constellation diagram showing expected EVM for this measurement
When interference was introduced, distortion suddenly increased. The constellation degraded—what caused this?
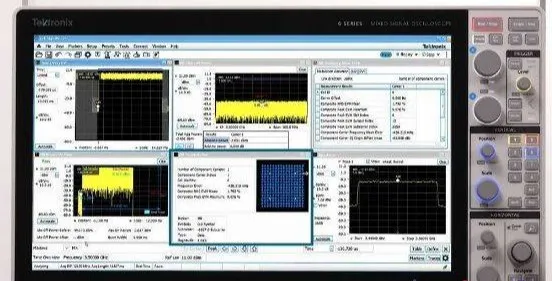
Figure 4. Constellation diagram showing elevated EVM for this measurement
The constellation EVM alternated between good and poor. The power-versus-time view also showed occasional power dropouts.
All RF-domain metrics indicated an issue. To investigate the root cause, the current draw was inspected. With a traditional VSA alone, correlating these domains would be difficult and require repeated guessing. The MSO6B can simultaneously show analog, digital, and RF signals, enabling correlation to identify the root cause.
Viewing the current probe on channel 6 alongside the RF output on channel 5 revealed periodic drops in current.
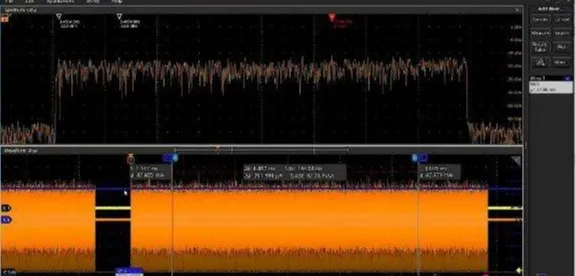
Figure 5. In this capture, the power supply delivers 48 mA (channel 6, blue), and the amplifier output (channel 5, orange) is nominal
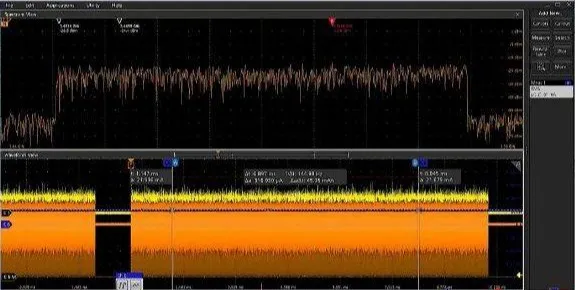
Figure 6. In this capture, the power supply delivers 22 mA (channel 6, blue), and the amplifier output (channel 5, orange) has dropped
Next, the trigger source was changed to the current probe on channel 6 to capture the falling current events rather than triggering on RF pulses.
Since normal operation occurred at about 47 mA, the trigger threshold was set to 43 mA to capture the falling edge. The trigger was configured for the current edge instead of a pulse.
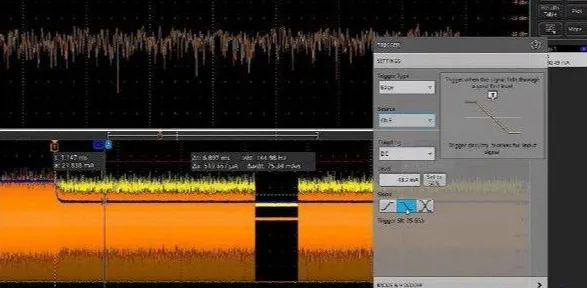
Figure 7. Trigger set to capture falling current events to align captures of low-current conditions
Correlating the oscilloscope channels to the RF performance drop, and returning to SignalVu, allowed the capture of the moment when current started to fall.
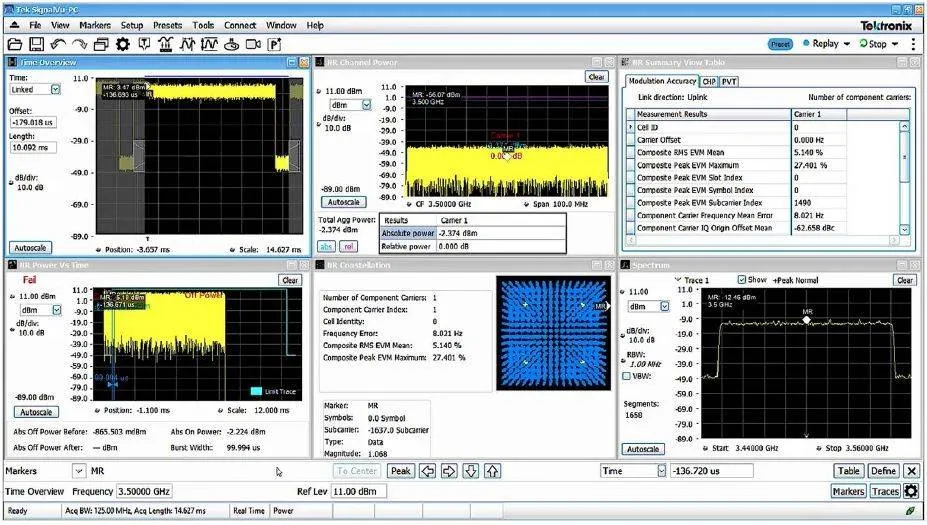
Figure 8. When triggered on low current, the constellation consistently shows high EVM
The current drop correlated precisely with the RF performance degradation on the oscilloscope display. This confirmed that the trigger captured a current-drop event, and the constellation and EVM views consistently showed the fault condition.
To capture normal-current conditions, the trigger direction was changed to rising edge. With this setting, the oscilloscope captured instances when the current returned to within specification. In the SignalVu VSA application, each captured 5G signal then met the specification.
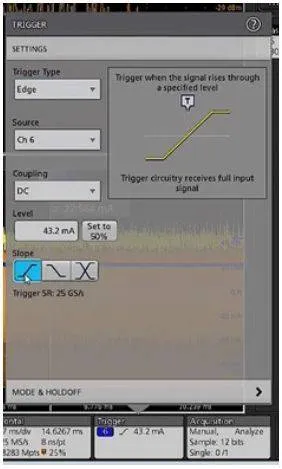
Figure 9. Trigger changed to capture rising current, capturing the restored current condition
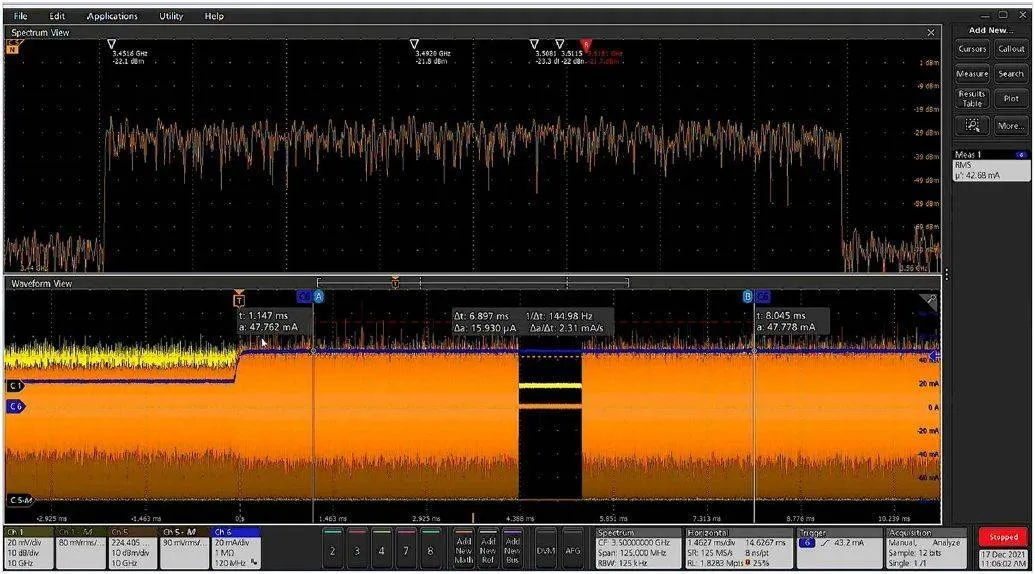
Figure 10. Trigger on the current rising edge to identify the measurement point when current returns to normal
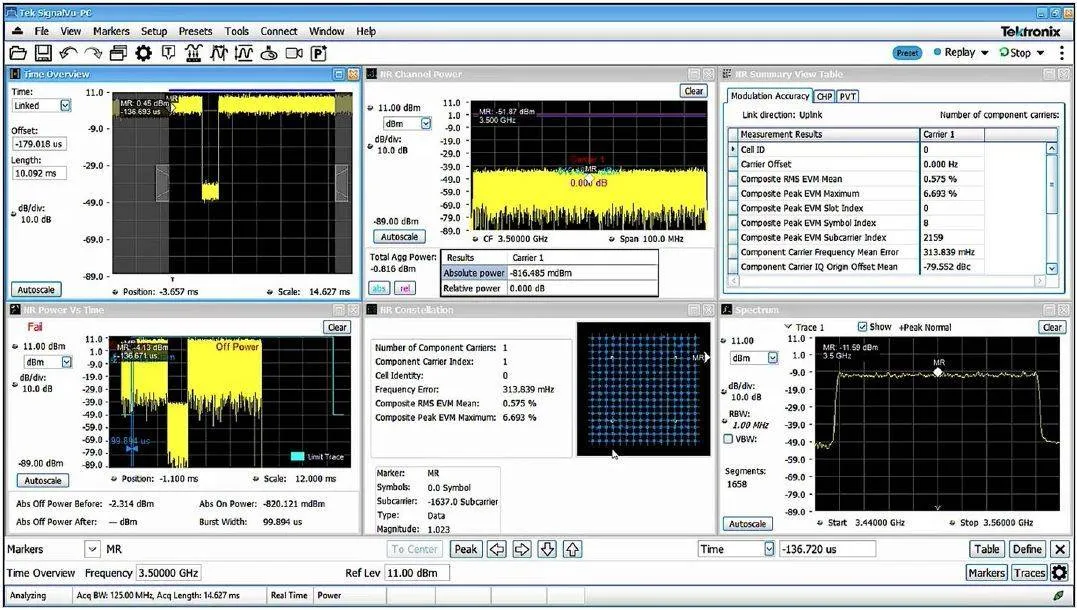
Figure 11. When measurements are taken at normal current, EVM stays within specification
When the current was out of specification, RF output and EVM also fell out of specification. The RF performance degradation was therefore associated with periodic drops in power-supply current.
In this demonstration, current was stepped using the SMU. Designers may identify deeper causes for current variation, such as DPD algorithm behavior or coefficient loading errors.
An oscilloscope-based solution can also measure and compute precise amplifier power metrics, such as power-added efficiency (PAE).
If the device had a digital control bus, that bus could be triggered and correlated to the observed behavior.
Tektronix Implementation Summary
Synchronized multichannel spectrum analysis and time-domain waveforms speed 5G debugging.
5G system development involves digital, analog, and RF signals. The ability to analyze a signal across domains is essential for finding interference, glitches, spurs, dropouts, and other faults.
In the 4-series, 5-series, and 6-series MSO oscilloscopes, each input is backed by a custom ASIC with a 12-bit ADC. Each ADC sends high-speed digitized data along two paths. This architecture allows independent control of time-domain and frequency-domain acquisitions, enabling simultaneous optimization of waveform and spectrum views for a given signal. The unique synchronized spectrum view supports simultaneous measurements in the time, RF, and digital domains and can support up to eight channels.
The MSO6B supports a frequency range up to 10 GHz and analysis bandwidth up to 2 GHz, enabling direct measurement of Sub-6 (FR1) 5G signals.
Instruments and Software Used
- Tektronix MSO6B mixed-signal oscilloscope
- Tektronix AWG70000B arbitrary waveform generator
- SignalVu VSA software with 5G NR option
- Mini-Circuits GVA-123+ amplifier (DUT)
- Coupler ZDC-10-0123
- Keithley source-measure unit
- Current probe