ALLPCB


Summary
This article summarizes a recent open-source work from the MA/RS lab at the University of Hong Kong. The study uses LiDAR to achieve microsecond-scale motion event detection and was published in Nature Communications.
Abstract
Robots operating in dynamic environments need to detect motion events with microsecond-level latency. This task, called motion event detection, is often addressed with event cameras. Although LiDAR sensors are critical to robotics because of their dense and accurate depth measurements, their use for event detection has not been deeply explored. Existing approaches accumulate LiDAR points into frames and detect motion at the object level, resulting in delays of tens to hundreds of milliseconds. We propose a different approach, called M-detector, which determines whether an individual point is on a moving object immediately after the point is received, yielding per-point detection latency of only a few microseconds. M-detector is designed based on the occlusion principle and can work with various LiDAR sensor types in different environments. Experiments demonstrate M-detector's effectiveness across datasets and applications, showing advantages in accuracy, computational efficiency, detection latency, and generalization.
Demonstration
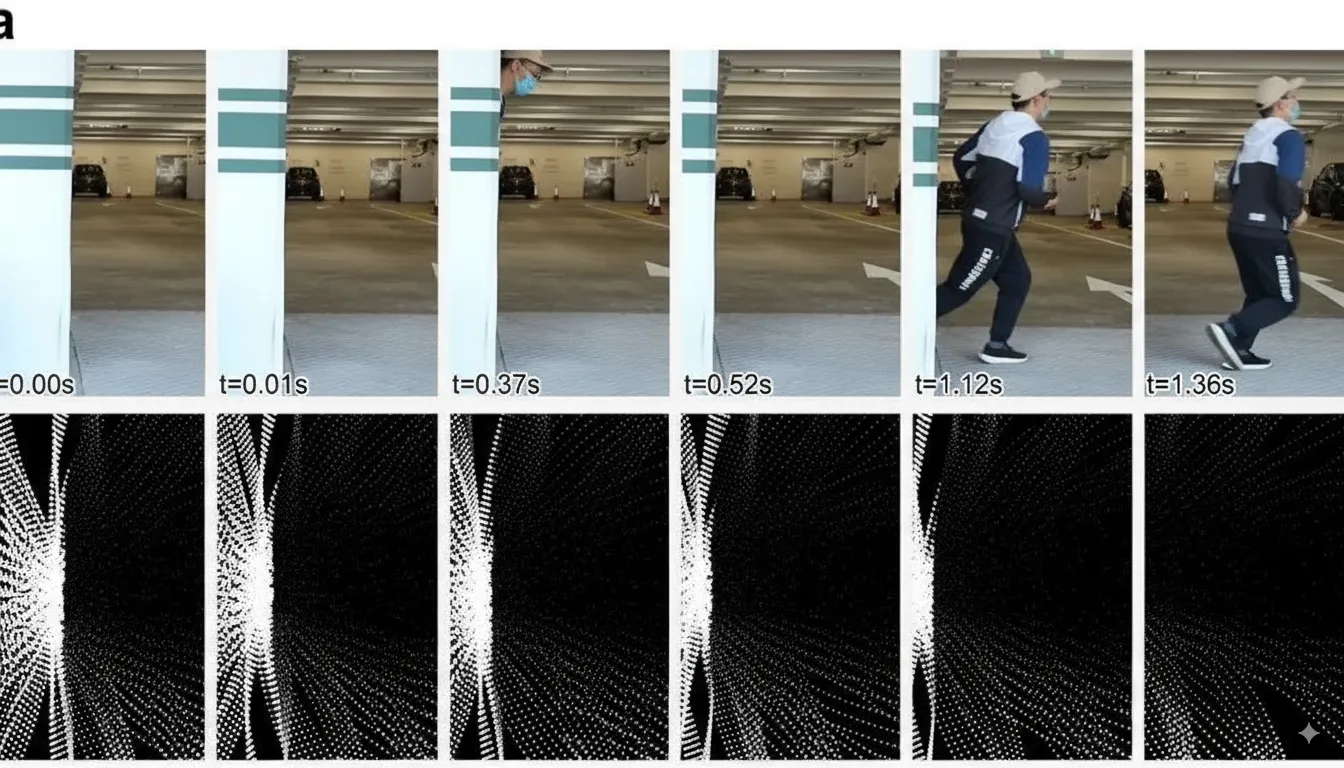
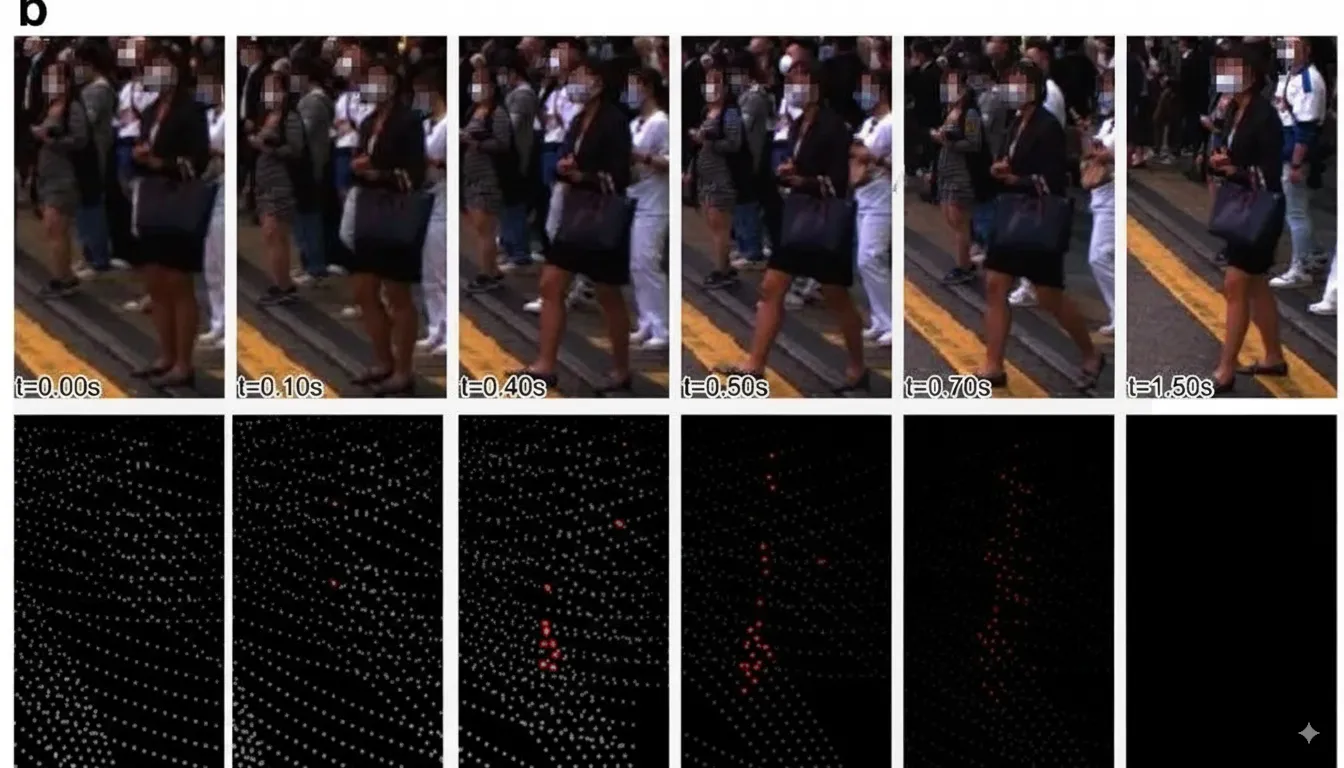
M-detector performs instantaneous detection of motion in a scene, for example detecting a pedestrian suddenly crossing the road. In one scenario, a pedestrian emerges from behind a wall at 0.01 s and quickly enters the roadway without checking traffic. In another scenario, a standing pedestrian at an intersection begins to walk at 0.4 s while others remain stationary. The top rows show image sequences, and the bottom rows show the last 100 ms of M-detector detections on a Livox AVIA LiDAR, which uses a non-repetitive, irregular scanning pattern. M-detector classifies each point as moving or static immediately after point arrival, producing detection latency smaller than the LiDAR point sampling interval (a few microseconds). M-detector is designed from first principles using the occlusion principle, detecting points sampled from any moving part of the scene regardless of shape.
How it Works
M-detector performs per-point motion-event detection from LiDAR point streams, resulting in detection latencies of only 2 to 4 μs. Its low latency is analogous to magnocellular cells (M-cells) in the lateral geniculate nucleus (LGN) of the human visual system, which respond quickly but at lower spatial resolution. By contrast, accumulating points into frames yields higher resolution but longer latency (for example, 100 ms), analogous to parvocellular cells (P-cells) in the LGN.

Occlusion Principle
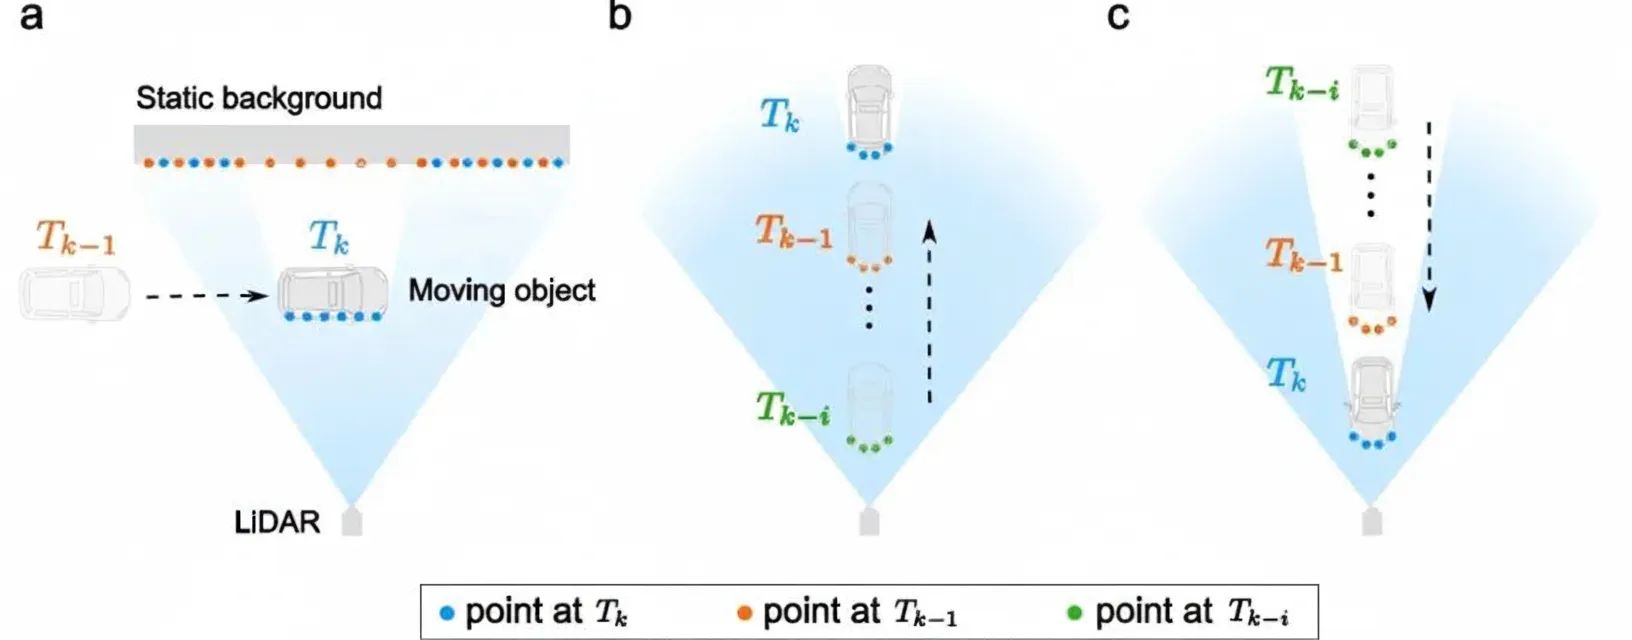
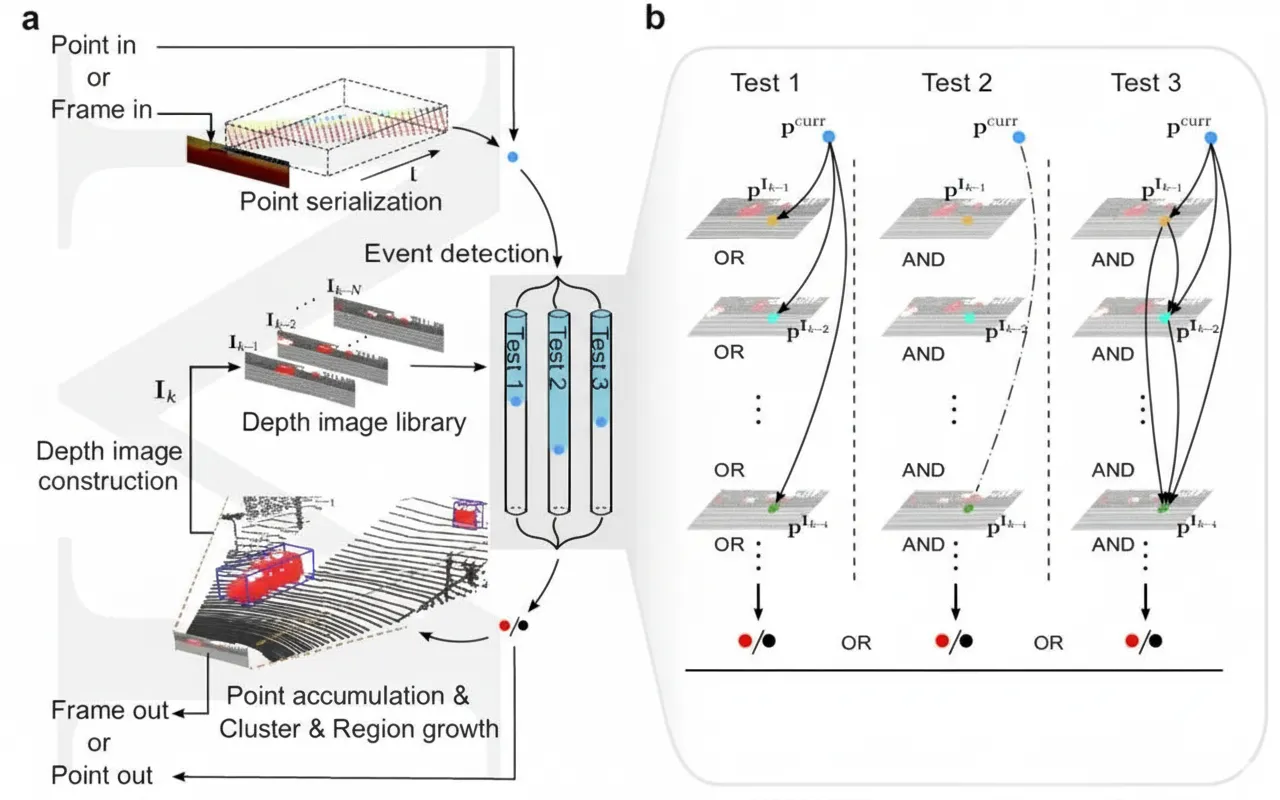
a: When an object crosses a LiDAR beam, the current point (blue) occludes a previously acquired point at time Tk-1 (orange). b: If the object moves away from the sensor along the beam, the current point (blue) will be occluded by all prior points (the orange point at Tk-1 and the green points at Tk-i), and those prior points may themselves be occluded by even earlier returns. If the object moves toward the sensor along the beam, the current point (blue) will occlude all prior points (orange and green), and those prior points may further occlude earlier points.
System Workflow of M-detector
Comparison with Other State-of-the-Art Methods
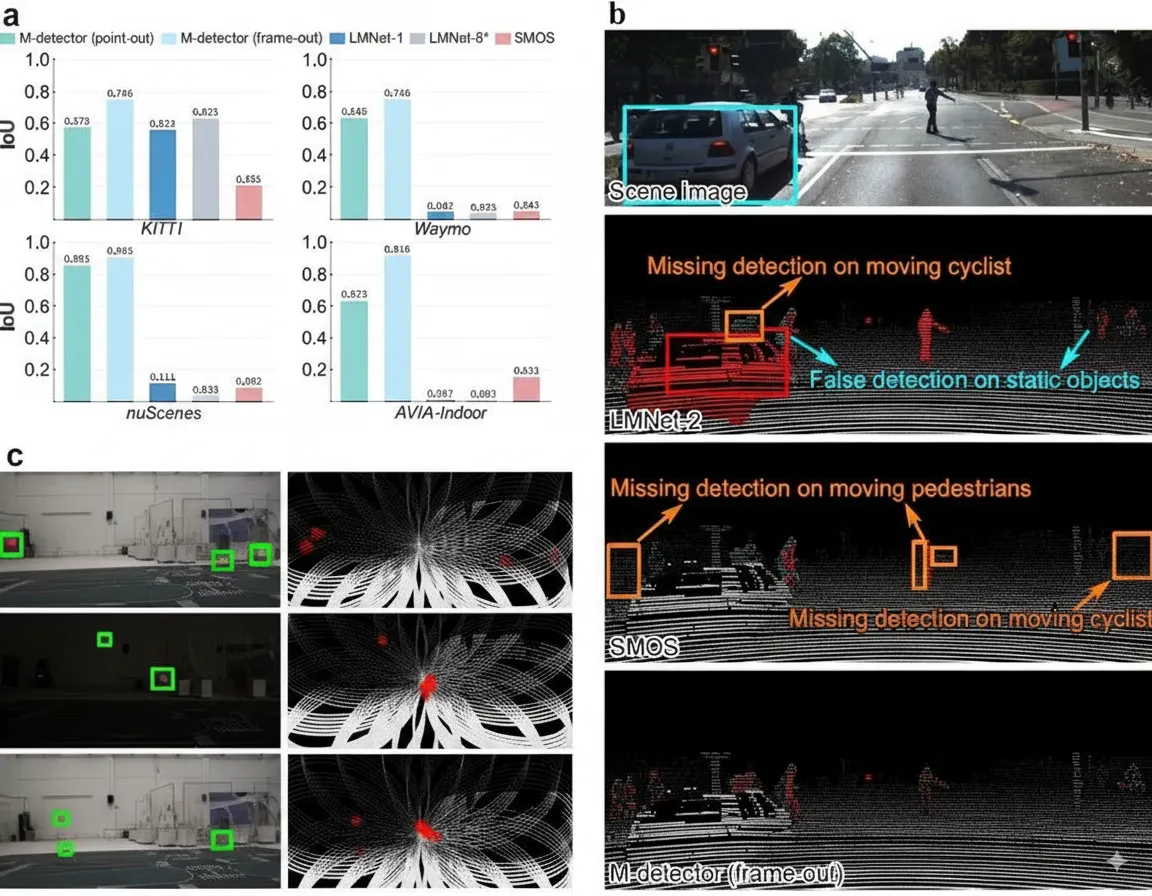
Performance of M-detector across datasets. a: IoU results of different methods on various datasets. b: Comparison of M-detector, LMNet-8*, and SMOS on the KITTI dataset. The scene image corresponds to frame 68 of sequence 15. c: Details of the AVIA-Indoor dataset. The left column shows camera images of the scene, and the right column shows M-detector detections in frame-out mode. In these visualizations, red points indicate event points detected by the method, and white points indicate non-event points.
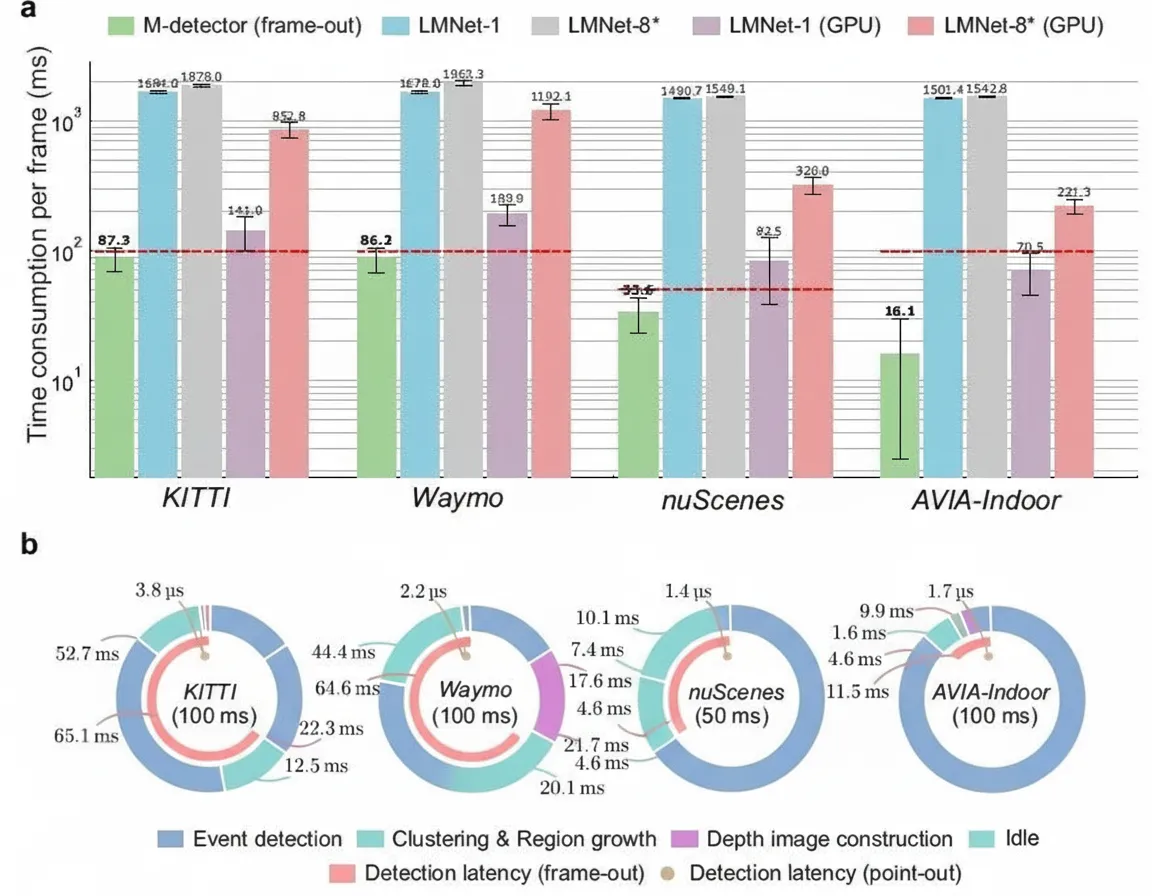
Computation time and detection latency across datasets. a: Per-frame computation time of different methods on various datasets, shown on a log scale. b: Breakdown of M-detector's time consumption and detection latency across datasets. The outer rings show decomposition of per-frame time, including event detection, clustering and region growing, and depth image construction. The total ring length represents the frame period, partitioned into the three steps with corresponding colors and numbers. Unshaded portions indicate idle time per frame. The pink middle-ring sector represents M-detector's detection latency in frame-out mode, caused by event detection together with clustering and region growing. The brown inner dot indicates M-detector's detection latency in point-out mode, caused solely by single-point event detection. The words and numbers at the ring centers indicate dataset names and corresponding frame periods.