ALLPCB


Overview
Learn about graph neural networks, including what GNNs are, the different types, and their use cases. Also learn how to build graph neural networks using PyTorch.
1. What is a graph?
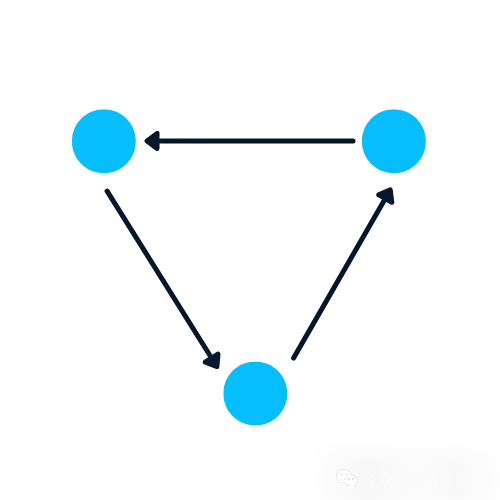
A graph is a data structure that contains nodes and edges. A node can represent a person, a place, or an object, and edges define relationships between nodes. Edges can be directed or undirected based on directional dependencies.
In the example below, blue circles are nodes and arrows are edges. The direction of an edge defines the dependency between two nodes.
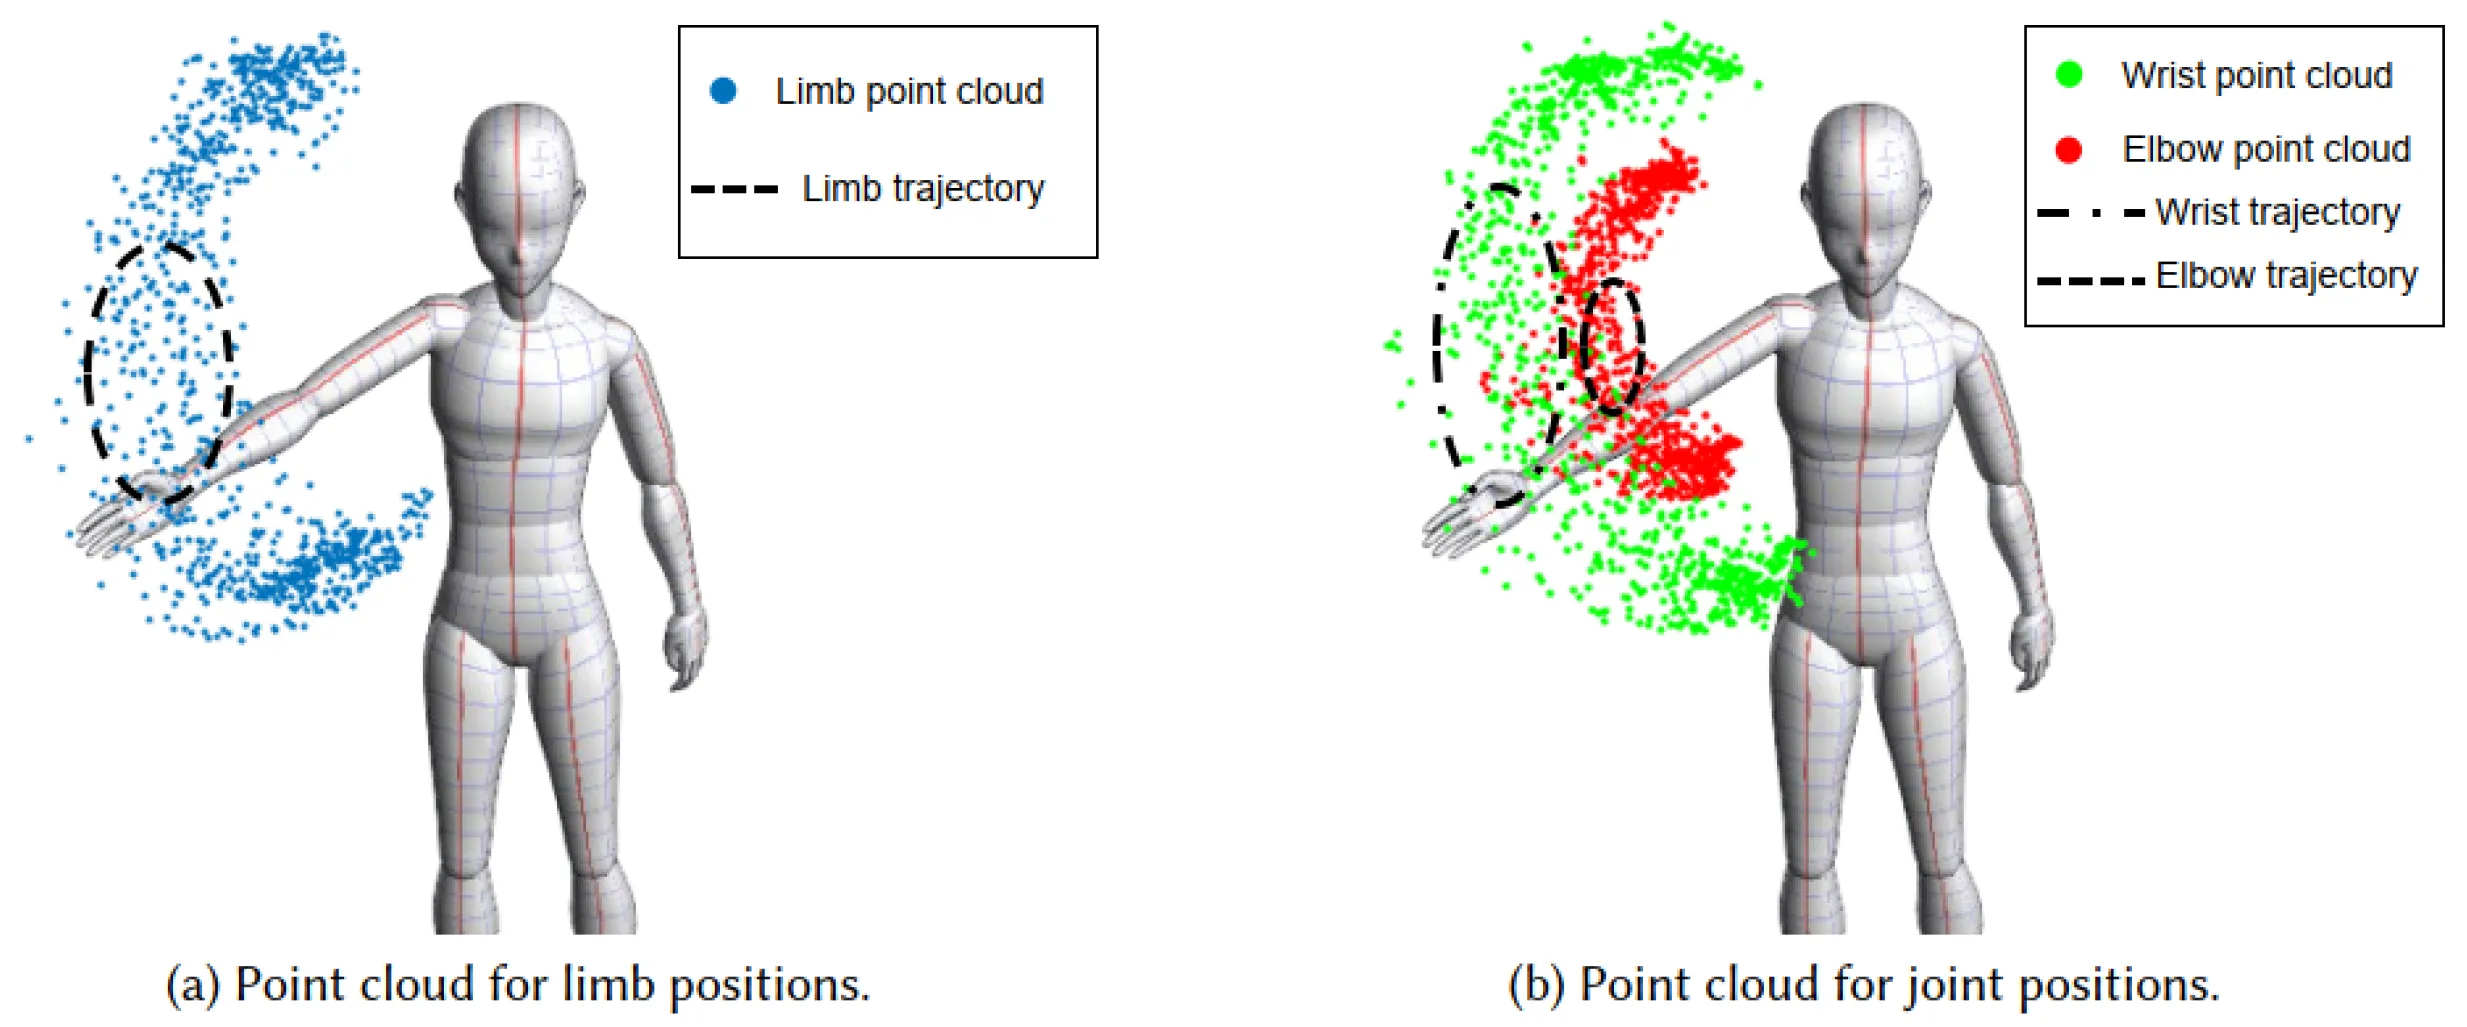
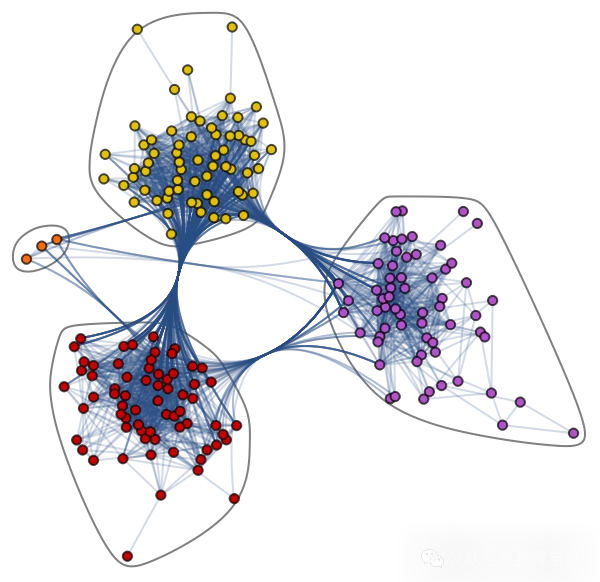
Consider a more complex graph dataset: the Jazz musicians network. It contains 198 nodes and 2742 edges.
In the community graph below, nodes of different colors represent various communities of jazz musicians, and edges connect them. There is a collaboration network where individual musicians have relationships both within and across communities.
Graphs are well suited to handling complex problems involving relationships and interactions. They are applied in pattern recognition, social network analysis, recommender systems, and semantic analysis. Building graph-based solutions provides insights into complex, interconnected datasets.
2. Creating graphs with NetworkX
In this section, we will learn how to create graphs using NetworkX.
import networkx as nx
H = nx.DiGraph()
#adding nodes
H.add_nodes_from([
  (0, {"color": "blue", "size": 250}),
  (1, {"color": "yellow", "size": 400}),
  (2, {"color": "orange", "size": 150}),
  (3, {"color": "red", "size": 600})
])
#adding edges
H.add_edges_from([
  (0, 1),
  (1, 2),
  (1, 0),
  (1, 3),
  (2, 3),
  (3,0)
])
node_colors = nx.get_node_attributes(H, "color").values()
colors = list(node_colors)
node_sizes = nx.get_node_attributes(H, "size").values()
sizes = list(node_sizes)
# Plotting Graph
nx.draw(H, with_labels=True, node_color=colors, node_size=sizes)
In the next step, we will use the to_undirected() function to convert the data structure from a directed graph to an undirected graph.
# Convert to undirected graph
G = H.to_undirected()
nx.draw(G, with_labels=True, node_color=colors, node_size=sizes)
3. Why is graph analysis difficult?
Graph-based data structures have several challenges that data scientists should understand before developing graph-based solutions.
Graphs exist in non-Euclidean space. They do not reside in simple 2D or 3D coordinate spaces, which makes interpreting the data more difficult. To visualize structure in 2D space, various dimensionality reduction tools must be used.
Graphs are dynamic; they do not have a fixed form. Two graphs that look visually different may have similar adjacency matrix representations. This complicates the use of traditional statistical tools for analysis.
The scale and dimensionality of a graph increase complexity for human interpretation. Dense structures with many nodes and thousands of edges are harder to understand and extract insights from.
4. What is a graph neural network (GNN)?
A graph neural network is a specialized type of neural network capable of operating on graph data structures. They are heavily influenced by convolutional neural networks and graph embedding techniques. GNNs are used for node prediction, edge prediction, and graph-level tasks.
5. Types of graph neural networks
There are several types of GNNs, many of which are variants of convolutional neural networks. This section reviews some of the most popular GNN architectures.
6. How do GNNs work? Building GNNs with PyTorch
We will construct and train a spectral graph convolution model for node classification. The source code is provided so you can run your first graph-based machine learning model.