ALLPCB


Overview
As embedded systems grow in scale and complexity, traditional debugging methods are less able to provide fine-grained insight into runtime behavior. RT-Thread offers a debugging tool called RT-Trace. Based on SWO, RT-Trace provides real-time tracing of operating system state and displays thread switches and interrupt responses through a web interface without requiring additional software.
This article demonstrates the RT-Trace Trace feature on a Cortex-M4 development board, covering configuration steps, visualization, and timing measurements to help developers evaluate the tool in practical projects.
1. Access RT-Trace configuration page
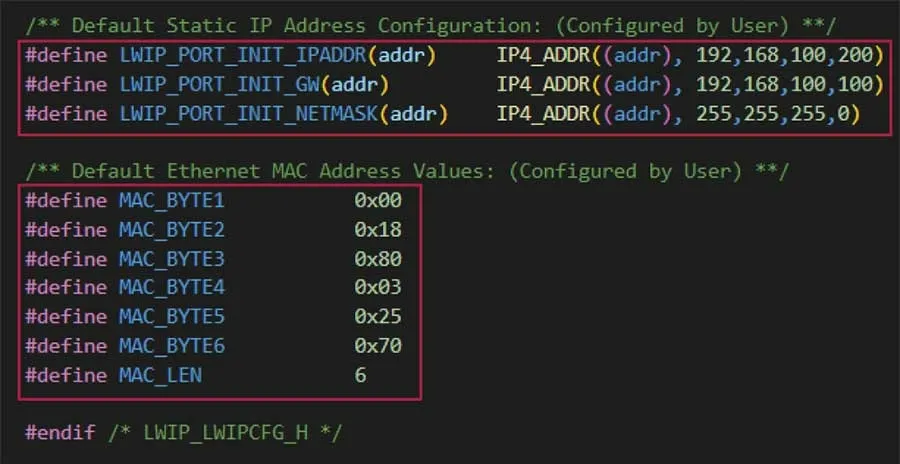
The board shows a Trace IP address printed in the lower-right corner. Enter that address in a browser to open the RT-Trace configuration page.
The first section presents an introduction to the Trace feature. Key points include:
- SWO-based RT-Thread OS tracing to capture thread relationships without additional software.
- Web UI that displays thread interactions in the browser in real time.
- Based on high-speed SWO Trace, with firmware upgrades planned to support persistent thread run records and CPU workload statistics over time.
- Future upgrades may add TPU Trace interfaces to expose additional internal information.
Because different RTOS implementations use different thread control block layouts, RT-Trace appears to be a specialized tool that requires adaptation for each RTOS variant.
2. Trace configuration
Click the Trace Config option to open the configuration page.
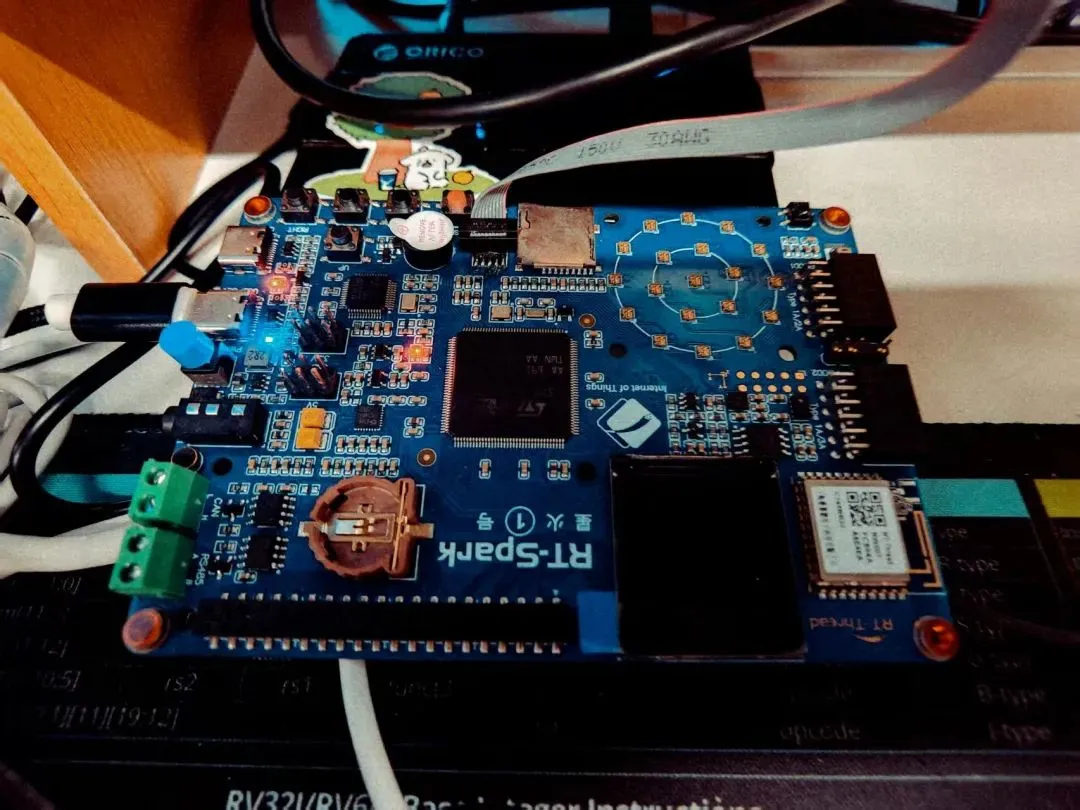
The test board uses an STM32 F407 with a Cortex-M4 core running RT-Thread on a Spark development board. The board is connected to the reserved Trace interface on the Spark board.
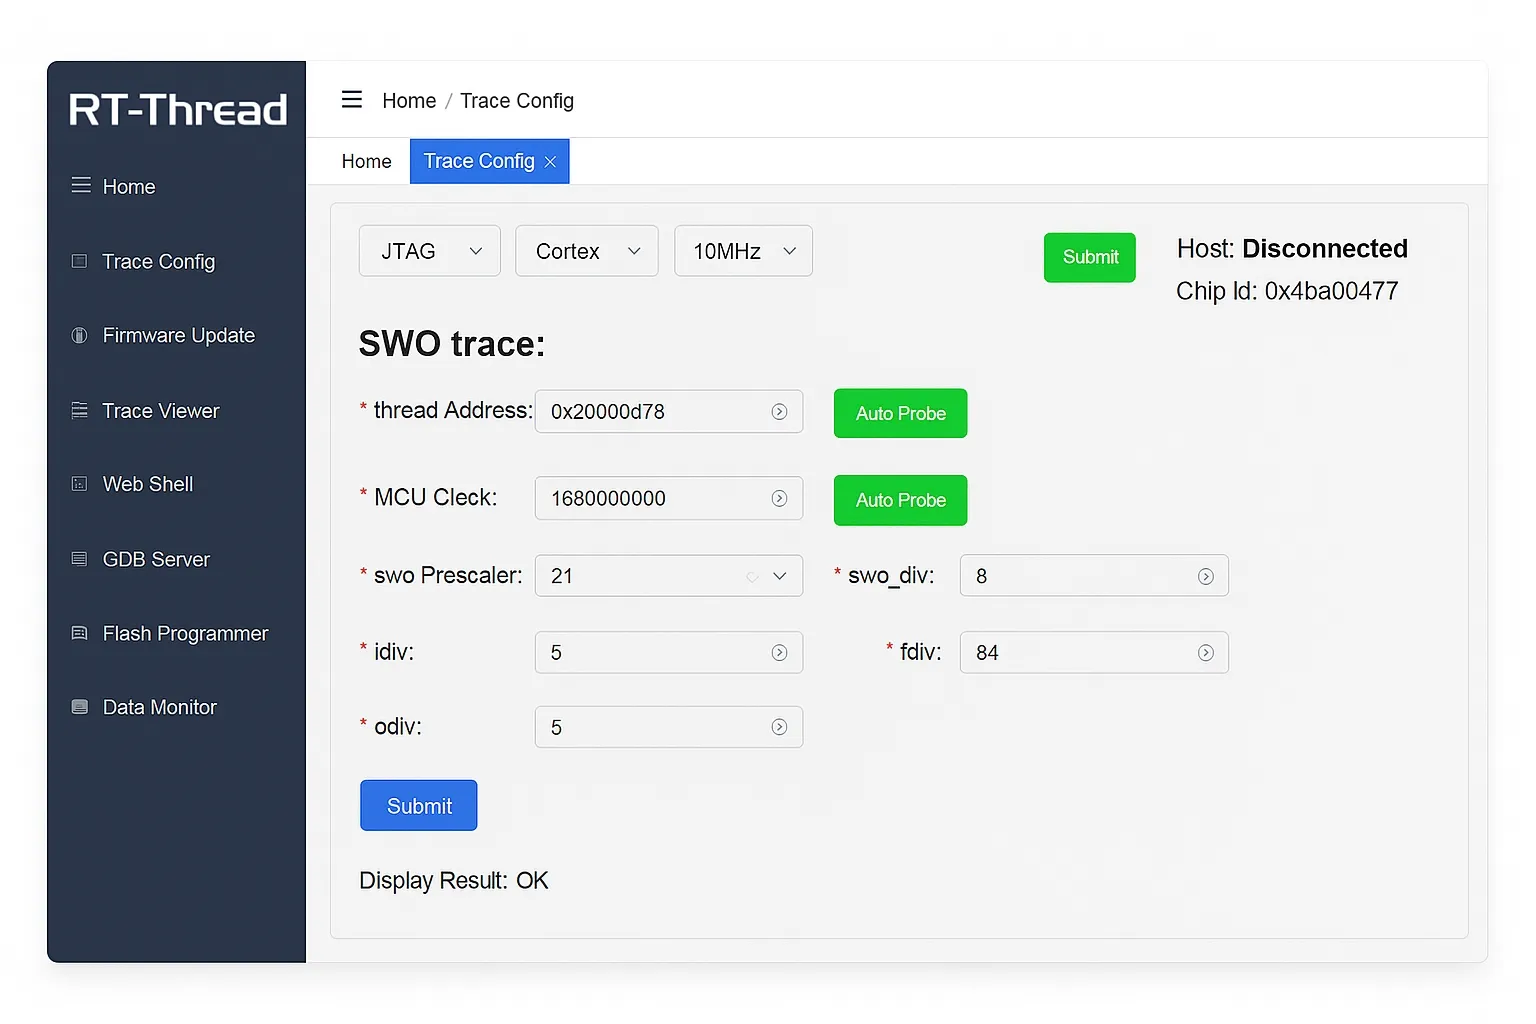
On the configuration page select JTAG and Cortex (RISC-V chips select RISC-V). Keep the default frequency and submit. If the device ID appears in the top-right, the connection is successful.
Next, click the two auto-detect options to detect thread addresses and the MCU clock frequency. (It is not clear how the thread addresses are detected.) Increase SWO frequency as needed; in this test it was set to 21. Submit the configuration to complete setup. The completed configuration page looks like this.
Then click Trace Viewer on the left to open the Trace page.
3. Trace Viewer
Click Start in the upper-left to begin tracing. After an appropriate period click Stop to end the trace. Then select the recorded trace (perfett0-trace) to view details.
Zoom into sections of the captured waveform for closer inspection.
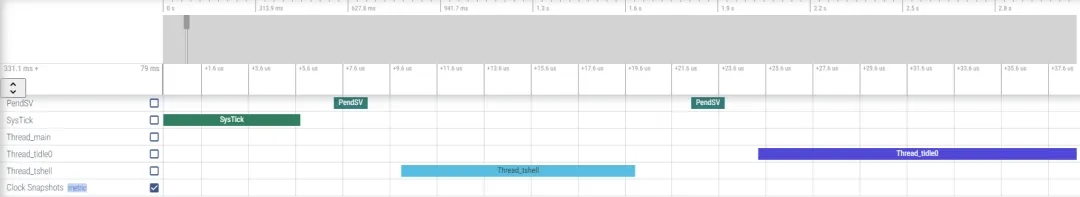
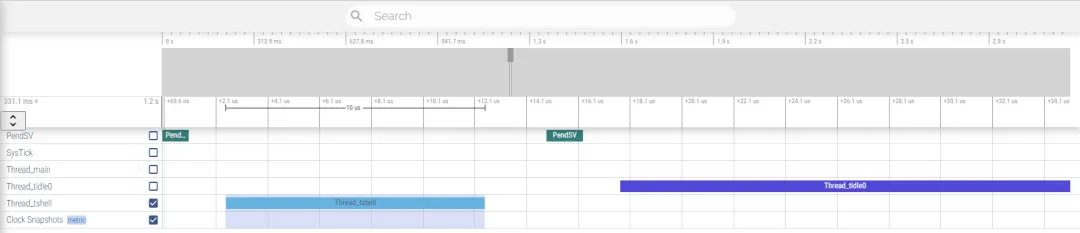
After zooming, the execution of threads and interrupts is visible. This visualization is useful when debugging RT-Thread projects. For example, to measure a thread execution time, select the start of the shell thread execution. The measurement shows the shell thread executed for 10us in this sample.
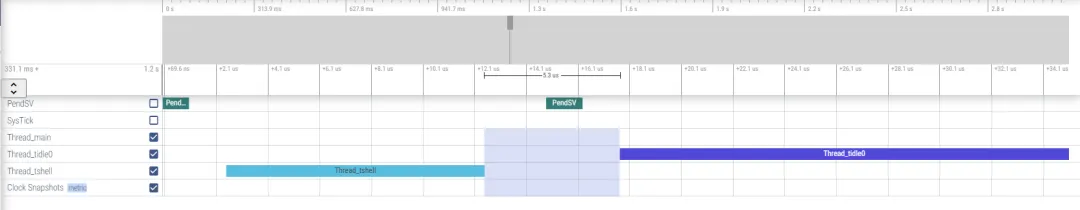
On Cortex-M devices the RTOS context switch is often performed by the PendSV interrupt. By selecting the transition region, you can measure the time taken for one thread to switch to another. In the example below, switching from the shell thread to the idle thread took 5.3us.
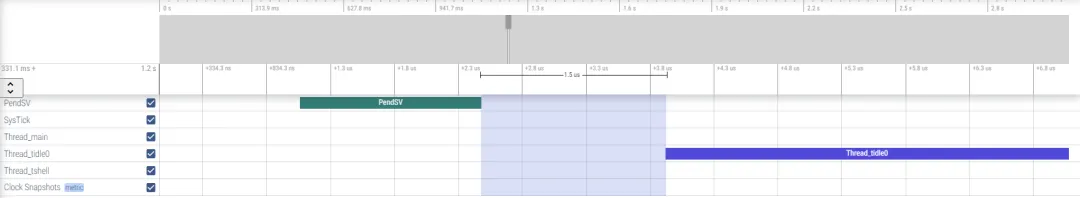
Similarly, you can measure the transition time from an interrupt to a thread. In the example below, the transition from PendSV to the idle thread took 1.5us.
4. Summary of experience
Advantages:
- Visualizes system thread run states, which aids debugging and thread optimization.
- Native support for RT-Thread reduces the need for additional adaptation for that RTOS; the detection features are convenient.
- Timing measurement capabilities make it straightforward to measure thread-to-thread, thread-to-interrupt, thread execution duration, and interrupt service routine durations, which helps optimize projects.
Limitations and suggestions:
- Currently the tool mainly supports ARM series chips. Projects using other architectures receive less support.
- A one-click report generation feature for common RTOS metrics could reduce manual measurement steps and streamline analysis.