ALLPCB


Overview
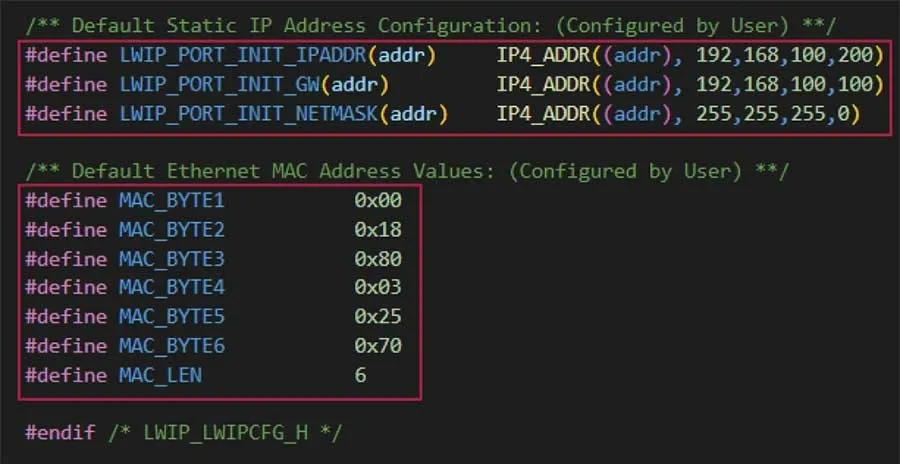
In embedded systems development, debugging remains one of the most challenging areas. Traditional approaches often rely on low-speed serial output, simple breakpoint debugging, or offline logging, which have limitations when dealing with complex real-time systems. RT-Trace is a debugging tool for RT-Thread that integrates real-time system tracing, data monitoring, GDB remote debugging, flash programming, and a virtual terminal. It supports visualization via a Web UI to improve development, debugging, and maintenance workflows for embedded projects.
Core Features
Trace (System Tracing)
- SWO-based RT-Thread OS tracing: capture thread switches, interrupt responses, and other system behaviors in real time without additional software.
- Web UI visualization: display thread relationship diagrams and execution timelines in the browser, with timing measurements such as thread execution time and switch time.
- Multiple trace interfaces: currently supports SWO trace, suitable for Cortex-M series chips.
- Persistent recording: supports long-duration capture (up to several minutes) and can export trace files in Perfetto format for offline analysis.
Monitor (Data Monitoring)
- Multi-channel real-time data acquisition: monitor variables, registers, memory addresses, and other data sources.
- Visual displays: dynamic representation of data changes through waveforms, gauge charts, and similar widgets in the Web UI.
- Custom layout: users can drag and drop widgets to build personalized monitoring panels.
- Supported architectures: Cortex-M series and HPMicro RISC-V; support for additional architectures is under development.
GDB Server (Remote Debugging)
- Supported architectures: full Cortex-M series (M0/M3/M4/M7) and RISC-V (GD32 VF, HPMicro, etc.).
- Debug features: supports hardware and software breakpoints, remote connections via IP and port, and integration with RT-Thread Studio, command-line GDB, or VSCode with the Cortex-Debug extension.
- Future expansion: planned integration with the Monitor for coordinated debugging and data observation, built-in flash download, and support for flash breakpoints with no limit on quantity.
Flash Programming
- One-click programming: upload HEX or BIN files via the Web UI and initiate programming without complex configuration.
- Automatic chip identification: attempts to match the chip model automatically, removing the need for manual selection.
- Progress visualization: programming progress is displayed on the onboard LCD and synchronized on the Web page.
- Format support: supports HEX (auto address parsing) and BIN (address must be specified) files.
Stack Protection
- Real-time stack overflow detection: configurable stack bottom guard area and alerts when stack usage approaches the overflow threshold.
- Multi-thread support: currently supports manually selecting threads for protection, with plans to support automatic protection for all threads.
- Precise localization: combined with trace data, it can locate where a stack overflow occurred.
Traditional Debugging and Additional Features
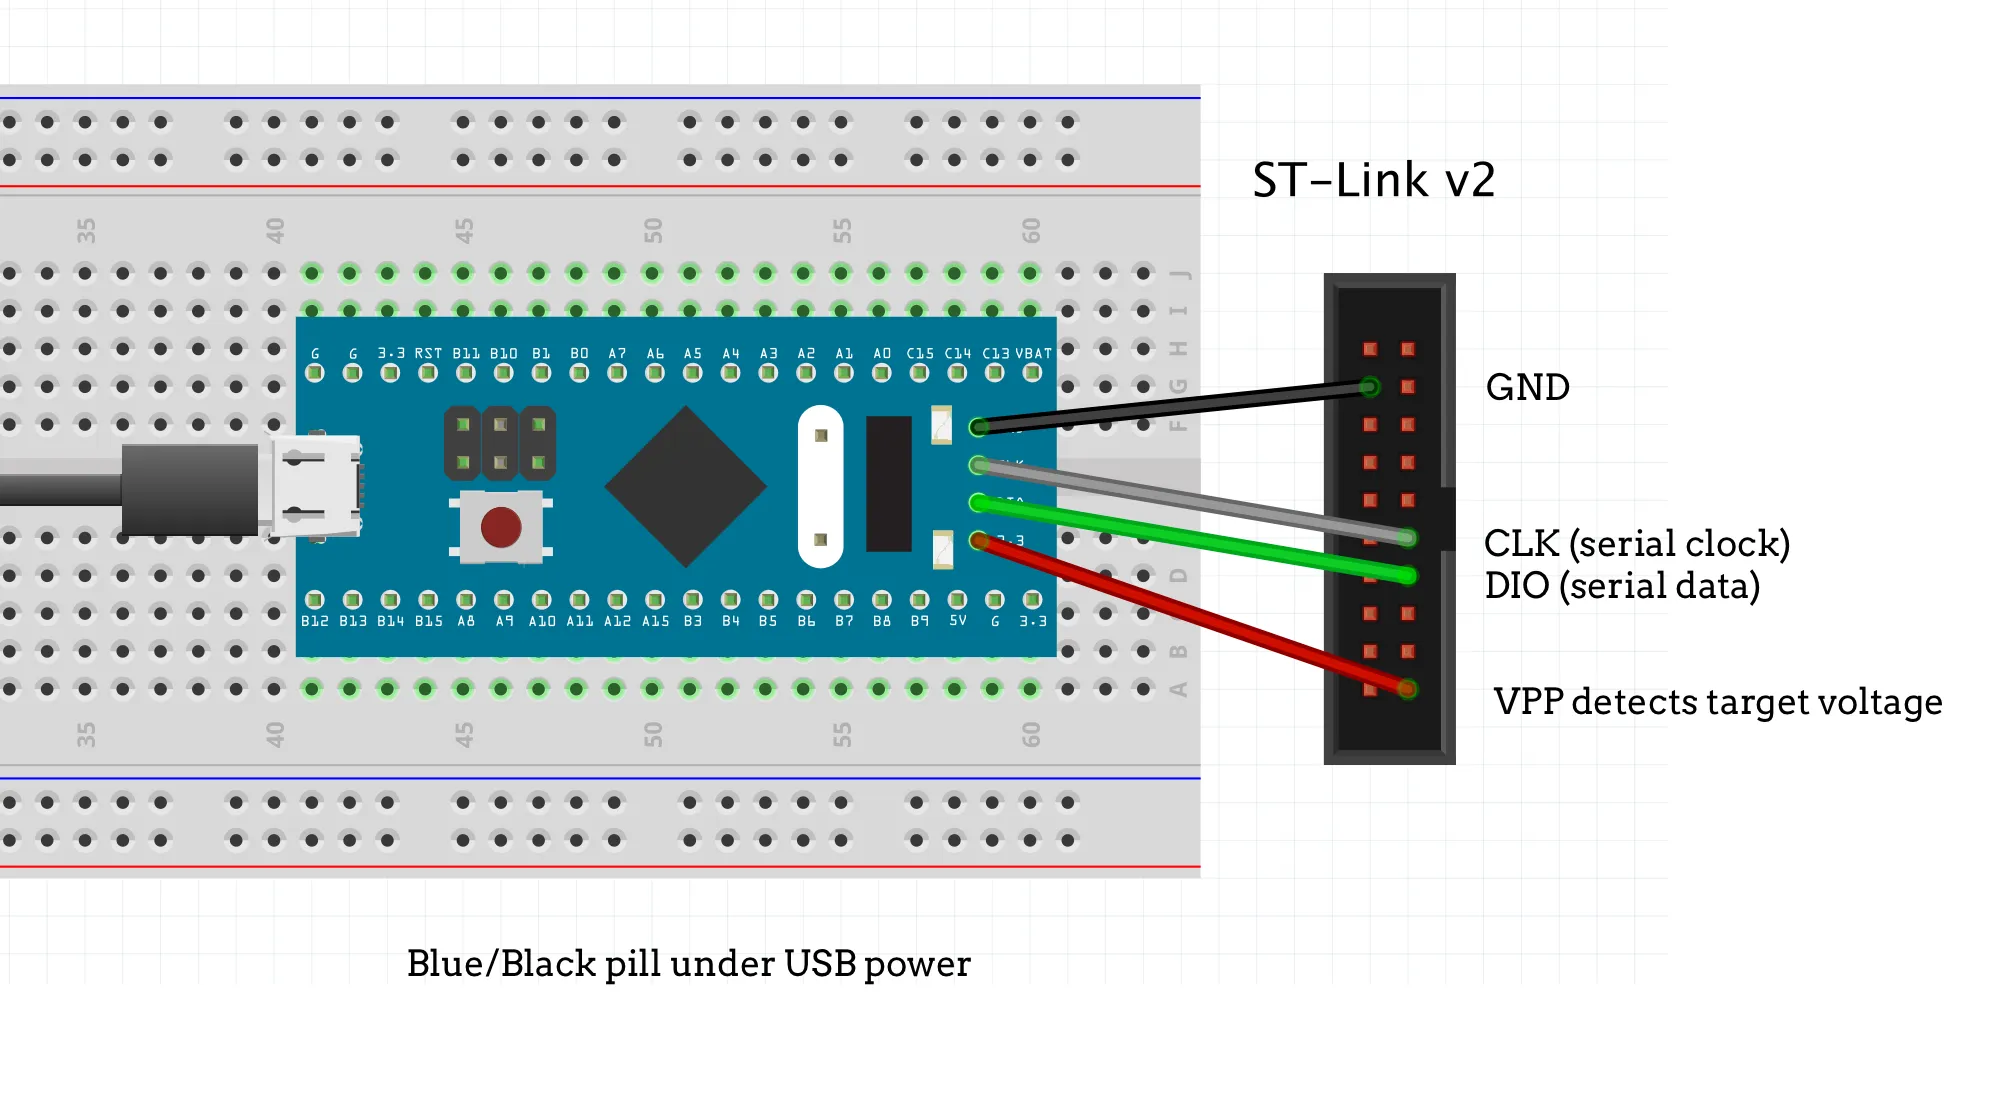
- SWD/JTAG debugging: supports high-speed debugging (up to 20 MHz) and is compatible with common IDEs such as Keil, IAR, and RT-Thread Studio.
- Serial passthrough: supports VCP serial passthrough at up to 10 Mbps.
- Onboard display: shows device status, IP address, voltage, pin states, and supports display rotation.
- Remote OTA updates: supports network-based firmware updates for the RT-Trace device itself.
- TF card external storage: supports persistent data logging to external storage.
Typical Use Cases
- RT-Thread system development and debugging
- Embedded system performance analysis and optimization
- Visualization and tuning of real-time system behavior
- Multi-thread stack overflow detection and localization
- Remote debugging and firmware programming
- Teaching, laboratory work, and product testing