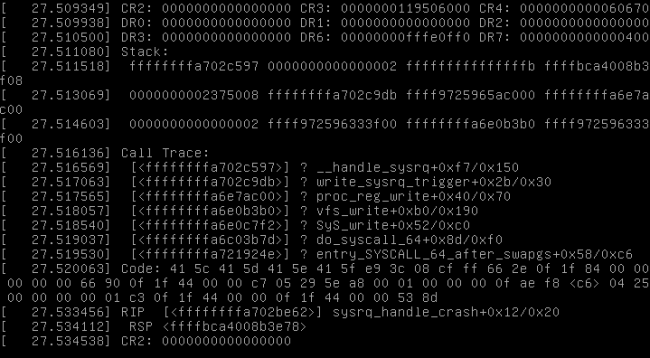
In embedded Linux development, especially on complex, collaborative software projects, it can be difficult to quickly locate the source of a program crash caused by a subtle bug. Simply reading through the code is often insufficient for rapid problem identification.
This article introduces a method using the `backtrace` tool to help pinpoint the location of a program crash.
1. How backtrace Analyzes Program Crashes
When a program crashes in a Linux system, it generates a corresponding signal. For example, accessing a null pointer triggers `SIGSEGV` (signal number 11).
The `signal` function can be used to capture this information. Once a signal is caught, a custom handler function can be executed to perform specific actions.
Within this custom handler, the `backtrace` function can be called to print the program's call stack information.
Finally, the `addr2line` utility can be used to convert the memory addresses from the stack trace into readable function names and line numbers.
To use `backtrace` for crash analysis, you must compile your program with the `-g` option to include debugging information.
Here is an example of using `addr2line` to convert an address into a function name and line number:
addr2line -e program_name -f -C 0x400526
Output:
main
/path/to/main.c:42
2. Key Functions
2.1 signal
2.1.1 Function Prototype
In C and C++, the `signal` function is used to set a signal handler. Its prototype is defined in the `<signal.h>` header file:
typedef void (*sighandler_t)(int);
sighandler_t signal(int signum, sighandler_t handler);
Parameters:
- `int signum`: The signal number (integer), such as:
- `SIGINT` (2): Interrupt signal (Ctrl+C)
- `SIGSEGV` (11): Segmentation fault
- `SIGILL` (4): Illegal instruction
- `SIGTERM` (15): Termination signal
- `SIGFPE` (8): Floating-point exception
- `sighandler_t handler`: A pointer to the signal handling function, which can be one of three values:
- A user-defined function of type `void handler(int signum)`
- `SIG_DFL`: The default action (e.g., terminate the program)
- `SIG_IGN`: Ignore the signal
Return Value:
- Success: Returns a pointer to the previous signal handler.
- Failure: Returns `SIG_ERR` and sets `errno` (e.g., `EINVAL` for an invalid signal).
2.1.2 Common Signals
Signals can be categorized as follows:
- Uncatchable Signals: Their behavior cannot be modified by `signal` or `sigaction` and is enforced by the system.
- `SIGKILL` (9)
- `SIGSTOP` (19)
- User-Defined Signals: Can be used by programs for custom logic, often for inter-process communication or debugging.
- `SIGUSR1` (10)
- `SIGUSR2` (12)
- Exception Signals: Typically triggered by program errors (like memory access violations). The default action is often to generate a core file for debugging.
- `SIGBUS` (7)
- `SIGSEGV` (11)
Default Behavior Differences:
While the default action for most signals is to terminate the program, some signals like `SIGCHLD` are ignored by default, and `SIGCONT` is used to resume a stopped process.
2.2 backtrace
In C and C++, the `backtrace` function retrieves the current program's call stack, which is useful for debugging and error handling. Its prototype is defined in the `<execinfo.h>` header file:
/* Get function addresses from the current call stack */
int backtrace(void **buffer, int size);
Parameters:
- `void **buffer`: A pointer to an array that will store the function addresses.
- `int size`: The maximum number of stack frames to retrieve.
Return Value:
- Success: The number of stack frames actually retrieved (not exceeding `size`).
- Failure: 0 (this is rare and usually only occurs if there is insufficient memory).
2.3 backtrace_symbols
This function converts the function addresses into human-readable strings (e.g., function names, offsets).
char **backtrace_symbols(void *const *buffer, int size);
Parameters:
- `void *const *buffer`: The array of function addresses returned by `backtrace`.
- `int size`: The number of frames returned by `backtrace`.
Return Value:
- Success: A pointer to an array of strings, where each string corresponds to a stack frame. This memory must be freed using `free()`.
- Failure: Returns `NULL` and sets `errno`.
2.4 backtrace_symbols_fd
This function writes the function addresses directly to a file descriptor.
void backtrace_symbols_fd(void *const *buffer, int size, int fd);
Parameters:
- `void *const *buffer`: Same as `backtrace_symbols`.
- `int size`: Same as `backtrace_symbols`.
- `int fd`: The file descriptor for output (e.g., `STDERR_FILENO`).
Return Value: None (output is written directly to the file).
3. Code Example
3.1 Main Function
//g++ -g test.cpp -o test
#include <execinfo.h>
#include <stdio.h>
#include <stdlib.h>
#include <unistd.h>
#include <csignal>
#include <string.h>
#include <fcntl.h>
#include <vector>
//<--- Add the signal handler function here
void SignalHandler(int signum);
void TestFun()
{
    printf("[%s] in\n", __func__);
    std::vector<int> a;
    printf("[%s] a[1]=%d\n", __func__, a[1]);
}
int main()
{
    std::vector<int> vSignalType = {SIGILL, SIGSEGV, SIGABRT};
    for (int &signalType : vSignalType)
    {
        if (SIG_ERR == signal(signalType, SignalHandler))
        {
            printf("[%s] signal for signalType:%d err\n", __func__, signalType);
        }
    }
    TestFun();
    return 0;
}
3.2 Signal Handler Function
#define MAX_STACK_FRAMES 100
void SignalHandler(int signum)
{
    printf("[%s] signum:%d(%s)\n", __func__, signum, strsignal(signum));
    signal(signum, SIG_DFL); // Restore default behavior
    // [backtrace] Get function addresses from the current call stack
    void *buffer[MAX_STACK_FRAMES];
    size_t size = backtrace(buffer, MAX_STACK_FRAMES);
    printf("[%s] backtrace() returned %zu addresses. Stack trace:\n", __func__, size);
    // [backtrace_symbols] Convert function addresses to readable strings
    char **symbols = (char **) backtrace_symbols(buffer, size);
    if (symbols == NULL)
    {
        printf("[%s] backtrace_symbols() null\n", __func__);
        return;
    }
    for (size_t i = 0; i < size; ++i)
    {
        printf("#%d %s\n", (int)i, symbols[i]); // Print each function address
    }
    free(symbols);
    // [backtrace_symbols_fd] Write function addresses directly to a file
    int fd = open("backtrace.txt", O_CREAT | O_WRONLY, S_IRWXU | S_IRWXG | S_IRWXO);
    if (fd >= 0)
    {
        backtrace_symbols_fd(buffer, size, fd);
        close(fd);
    }
}
3.3 Parsing backtrace with addr2line
#!/bin/sh
if [ $# -lt 2 ]; then
    echo "example: myaddr2line.sh test backtrace.log"
    exit 1
fi
BIN_FILE=$1
BACK_TRACE_FILE=$2
lines=$(cat $BACK_TRACE_FILE | grep ${BIN_FILE})
for line in ${lines}; do
    addr=$(echo $line | awk -F '(' '{print $2}' | awk -F ')' '{print $1}')
    addr2line -e ${BIN_FILE} -C -f $addr
done
The `addr2line` utility converts program addresses into source code locations (file names and line numbers).
3.4 Test Results
The output correctly identifies line 50 of `test.cpp` as the crash location. The crash occurs because the code attempts to access `vector[1]` on an empty `vector a`.
The call stack is as follows:
- The `main` function (line 65 of `test.cpp`) calls `TestFun`.
- The `TestFun` function (line 50 of `test.cpp`) executes `printf("[%s] a[1]=%d\n", __func__, a[1]);`.
- The crash triggers a `SIGSEGV` signal, which is caught by `SignalHandler`, and the stack trace is processed by `backtrace` starting at line 20 of `test.cpp`.
The information printed by `backtrace_symbols` to the console is identical to the information saved to `backtrace.txt` by `backtrace_symbols_fd`.
The `myaddr2line.sh` script provides a convenient way to print all line number information. You can also use `addr2line` manually, though it is less efficient for multiple addresses.
Note that in the `backtrace` output, addresses in parentheses `()` and square brackets `[]` have different meanings, corresponding to the function address in the symbol table and the actual execution address, respectively.
However, in this specific example, the address within the parentheses was required for `addr2line` to display the line number. This warrants further investigation.
4. Summary
This article demonstrated how to use the `backtrace` tool to locate crash positions in Linux applications. The process involves capturing crash information with `signal`, recording the call stack at the time of the crash with `backtrace`, and finally, using `addr2line` to map memory addresses back to the corresponding source code line numbers.
 ALLPCB


