ALLPCB


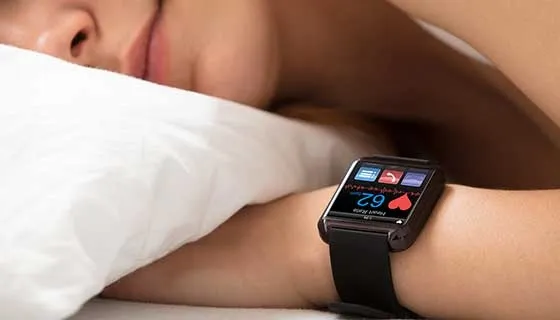
In modern society, increasing stress highlights the importance of sleep quality. Tracking sleep patterns helps individuals optimize rest. Smart bands and watches enable continuous monitoring of heart rate and sleep quality, but how do these compact devices achieve this?
Sleep Monitoring with Actigraphy
Smart bands use actigraphy to assess sleep quality. Developed in the 1980s by the U.S. military to evaluate troop performance, actigraphy has evolved into a portable, non-invasive, and cost-effective tool. It is widely used in sleep-wake pattern evaluation, activity intensity monitoring, drug testing, and behavioral genetics.
During light sleep, the body exhibits slight movements, which the device interprets as light sleep. In deep sleep, muscles relax, and limb movements are minimal or absent, leading the device to record it as deep sleep. Sleep quality monitoring relies on detecting significant body movements. For instance, rolling over while wearing a band may be mistaken for light sleep, even if the user is in deep sleep. Modern actigraphy devices typically use triaxial sensors to capture subtle movements in three dimensions. Analysis software processes this data to calculate energy expenditure, sleep parameters, wake time, wake frequency, and sleep efficiency.
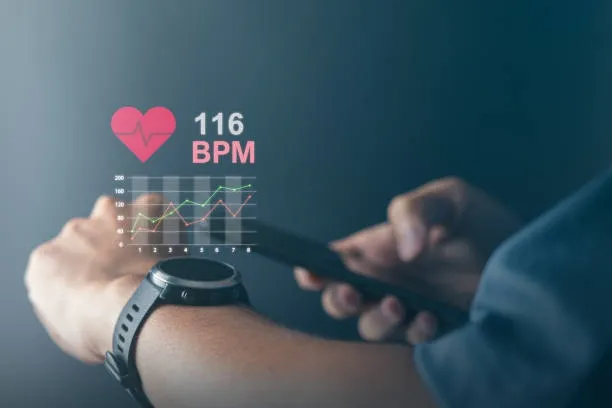
Heart Rate Monitoring Techniques
Smart bands employ two primary methods for heart rate monitoring: photoplethysmography (PPG) and electrocardiography (ECG).
Photoplethysmography (PPG)
PPG measures heart rate optically by detecting changes in blood light transmission caused by heartbeats. A smart band¡¯s backside features a photoreceiver emitting green light. Skin, muscle, and blood absorb some light, while the rest reflects back to the receiver. Blood absorbs more green light and reflects red light, so the device detects varying reflected light colors during heart contractions and relaxations. Algorithms convert these signals into heart rate data.
Green LEDs are common because blood, a red liquid, absorbs green light most effectively, ensuring accurate data. During heartbeats, increased blood flow in the wrist heightens green light absorption; between beats, reduced flow lowers absorption.
Electrocardiography (ECG)
ECG measures heart rate via electrical signals, similar to hospital electrocardiograms but simplified for wrist devices. Human tissues and fluids conduct electricity, with the heart acting as a power source. Electrical potential changes in heart muscle cells propagate to the body surface, creating potential differences. Electrodes on the device capture these changes, and algorithms derive heart rate values.
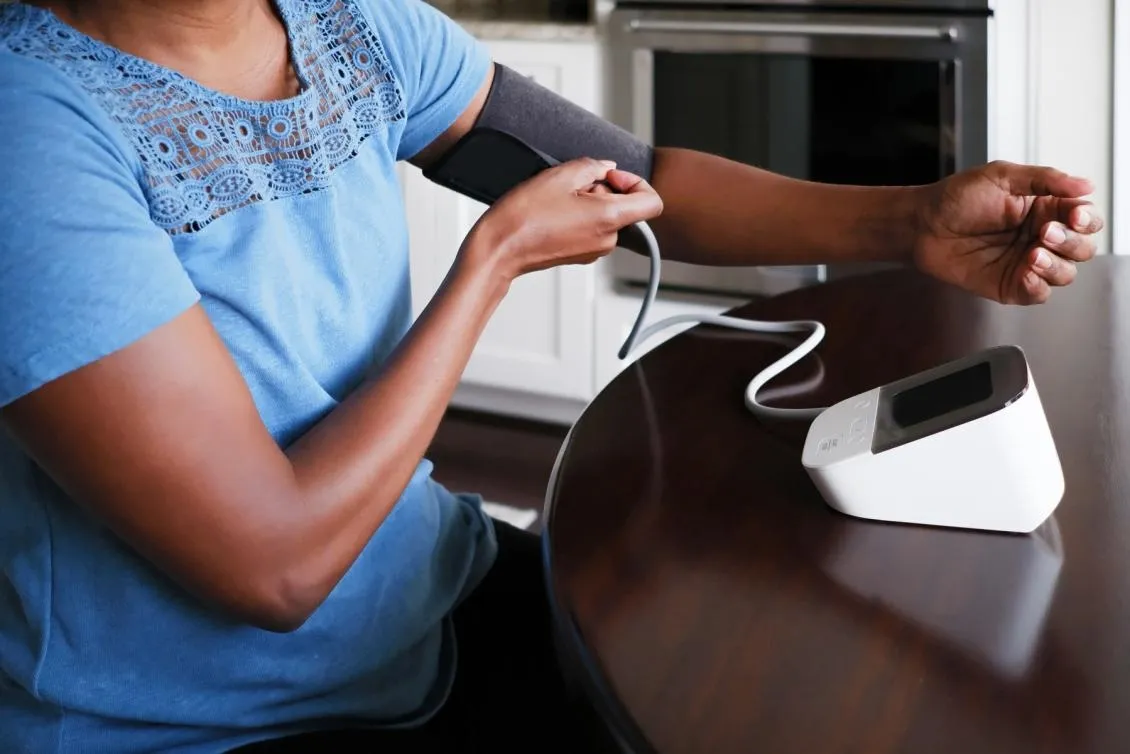
Limitations of Smart Bands
A 2018 report noted a smart band detecting a heart rate of 80 on tissue paper, illustrating a limitation. These devices cannot distinguish between living tissue and inanimate objects, assuming the surface is a wrist. When green light is emitted onto a non-living surface, reflected light produces erroneous readings. Smart bands estimate heart rate and sleep quality using sensors and algorithms, providing reasonable approximations. For precise health data, professional medical equipment is recommended.