ALLPCB


Abstract
This article presents a robust peak and onset detection algorithm for beat-to-beat pulse interval analysis using PPG signals. The method is demonstrated on ADI's multisensor wristwatch platform with a large collected dataset. Performance is quantified by coverage, sensitivity, positive predictive value, and the root-mean-square of successive differences (RMSSD) relative to beat-to-beat ECG reference.
Introduction
Heart rate (HR) monitoring is a core function of many wearable and clinical devices, but continuous HR measurement tools do not always provide beat-to-beat variability. Heart rate variability (HRV) represents variations in the time intervals between consecutive heartbeats extracted from electrocardiography (ECG) and reflects autonomic nervous system activity. HRV is widely used as a biomarker in clinical and health applications such as sleep staging, stress assessment, and fatigue monitoring. Because ECG measurement can be technically demanding or unavailable in some environments, PPG-derived pulse rate variability (PRV) can provide an alternative.
Photoplethysmographic (PPG) signals are obtained by illuminating skin with LEDs and measuring reflected light changes due to blood volume variations with a photodiode. PPG can yield cardiovascular metrics including heart rate, arterial pressure proxies, stiffness index, pulse transit time, pulse wave velocity, cardiac output surrogates, arterial compliance, and peripheral resistance. However, PPG-based algorithm performance degrades under poor perfusion, ambient light interference, and, most significantly, motion artifacts. Many signal-processing approaches, including motion suppression and frequency-tracking techniques, have been proposed to mitigate motion artifacts by using a tri-axial accelerometer colocated with the PPG sensor.
Accurate extraction of important fiducial points in the PPG waveform, such as systolic peaks, onsets, and dicrotic notches, is essential for PRV analysis. The waveform onset corresponds to the start of systolic ejection into the aorta, while the dicrotic notch indicates the end of ejection or aortic valve closure. The lack of robust detection algorithms for wrist PPG signals has limited the adoption of PPG-only PRV analysis. Prior PRV work either ignored fiducial points, relied on manual or empirical peak detection, or used unvalidated time-window methods to obtain pulse peaks.
This paper proposes a robust peak and onset detection algorithm adapted from methods originally developed for arterial blood pressure (ABP) waveforms. Wrist PPG signals collected by wearable devices include substantial motion artifacts, baseline fluctuations, reflection components, and other noise sources that can affect detection. Therefore, data are preprocessed before beat extraction. The automatic delineator used here is a hybrid method that combines multiple preprocessed versions of the raw PPG and the signal's first derivative to extract peaks and onsets. A large synchronized PPG and ECG database recorded on the ADI wristwatch platform was used for evaluation. The algorithm is memory-efficient and suitable for embedded deployment on the wristwatch platform. Validation compares coverage, sensitivity, positive predictive value, and RMSSD against ECG-derived beats.
PPG-Based Beat Detection Overview
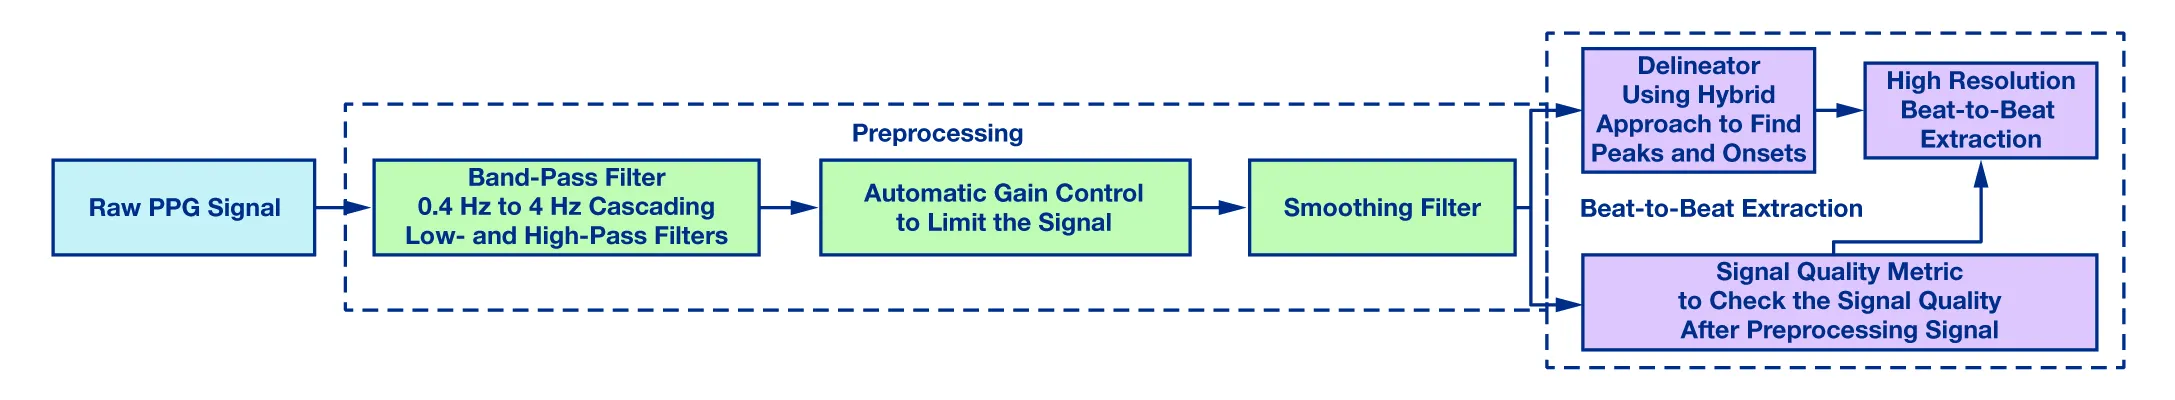
The wrist PPG beat detection system comprises two main stages: (i) preprocessing and (ii) a high-resolution beat extraction module. The block diagram is shown in Figure 1.
Preprocessing
PPG signals are sensitive to poor peripheral perfusion and motion artifacts. To minimize these effects prior to beat-level analysis, the preprocessing stage includes:
- Windowing and block processing
- Bandpass filtering (0.4 Hz to 4 Hz)
- Automatic gain control (AGC) to limit signal amplitude
- Smoothing and baseline drift removal
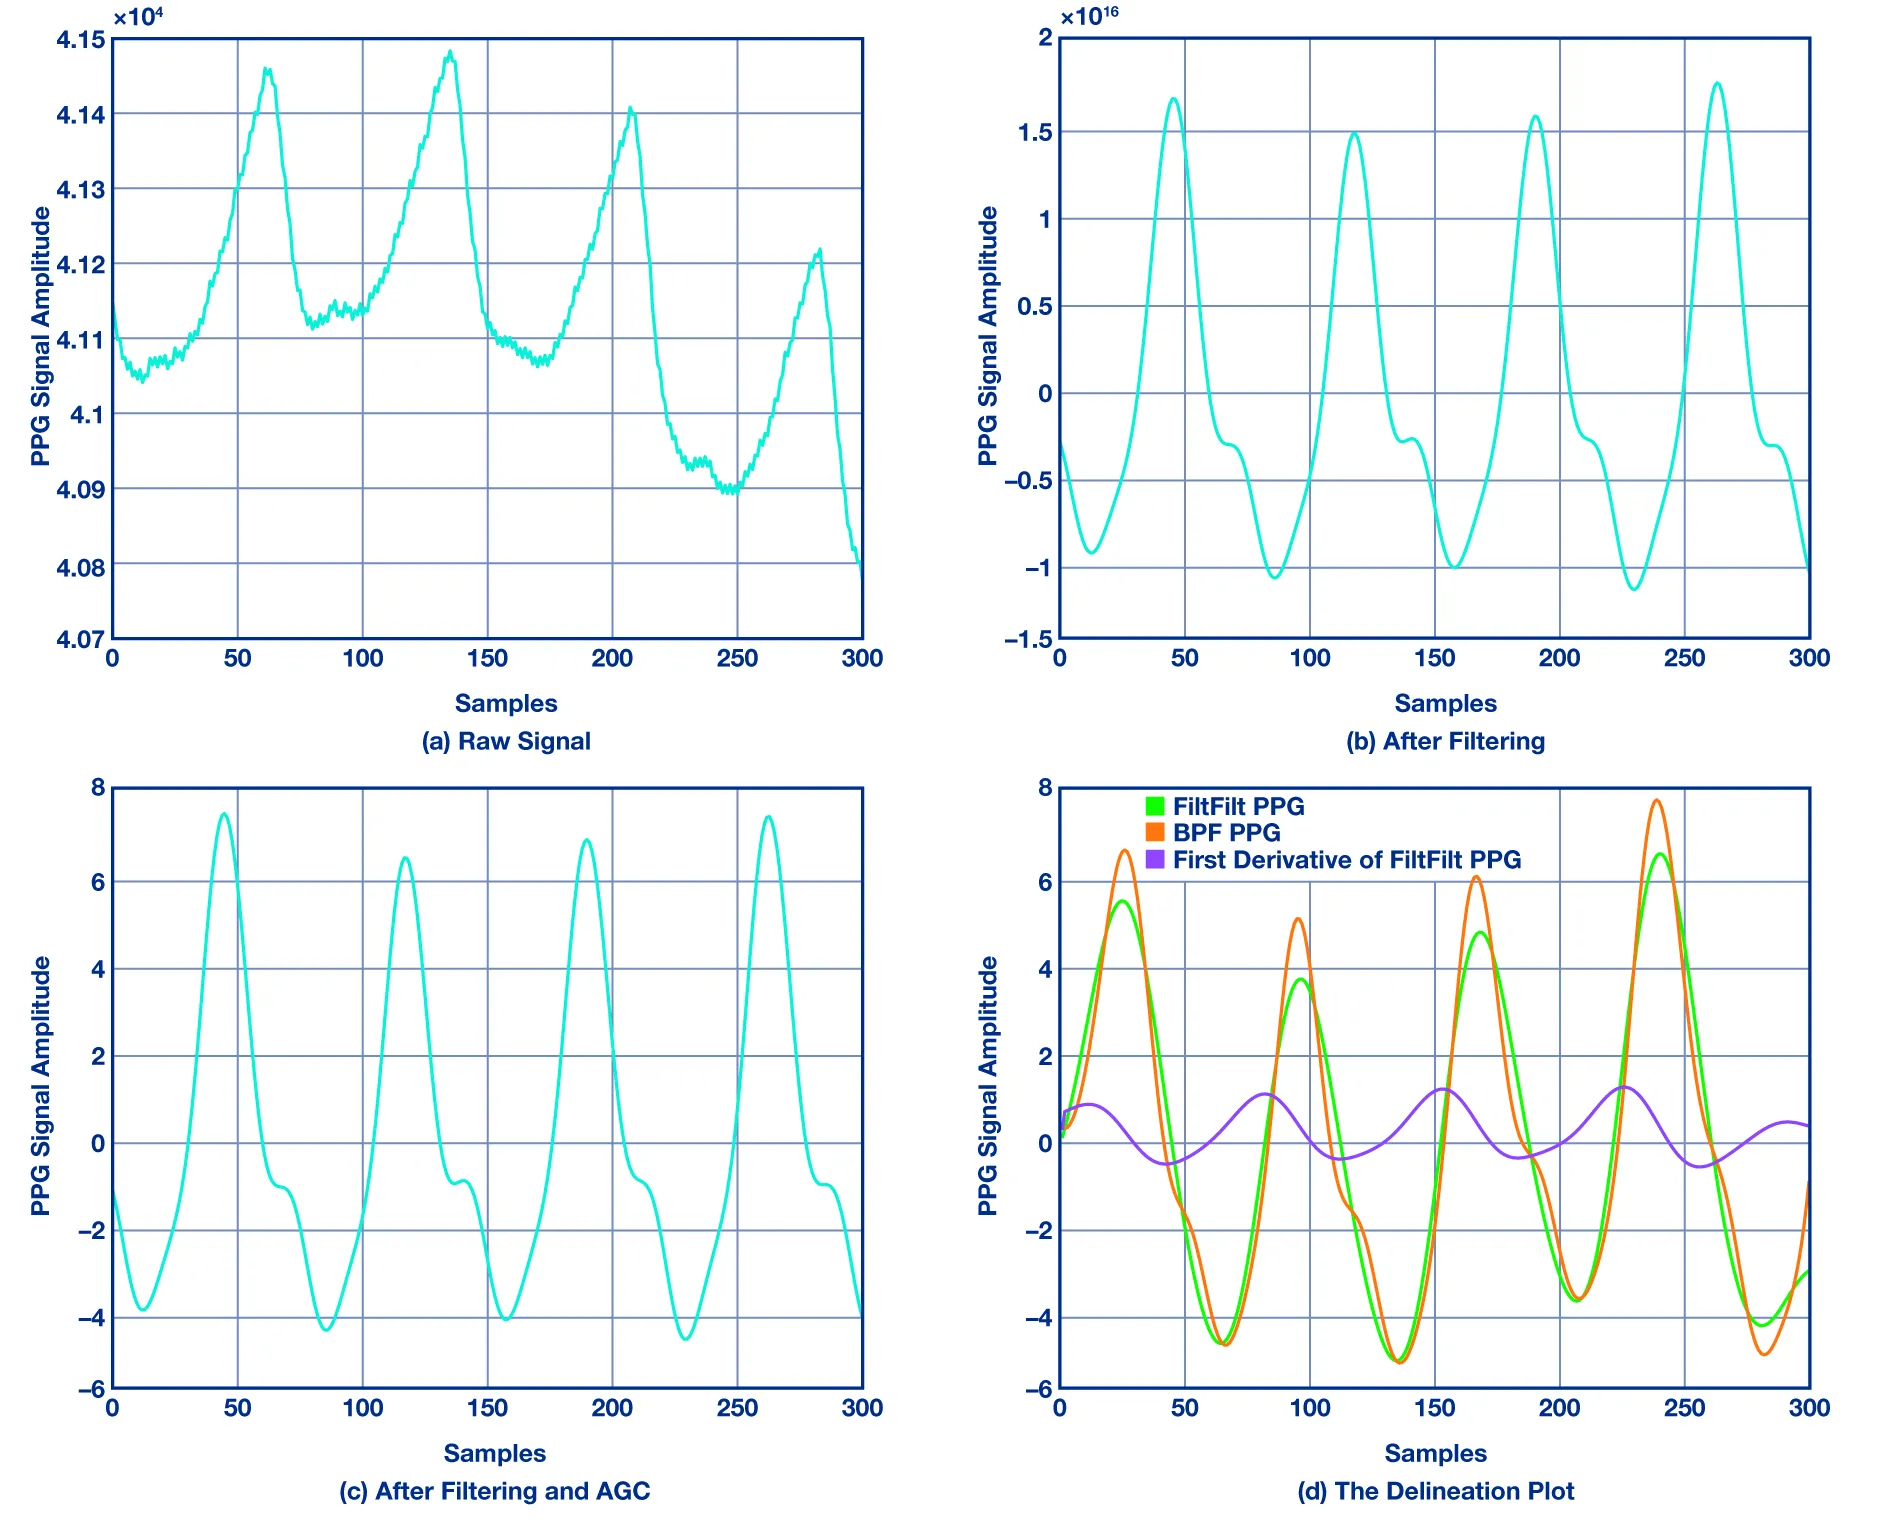
Input PPG data are processed in T-second frames with overlapping blocks using an mT moving window (for example, m = 3/4 overlap). A bandpass filter removes high-frequency components (for example, power-line interference) and low-frequency components such as changes in capillary density, venous blood volume, and temperature. Figure 2a and 2b illustrate the PPG signal before and after filtering. The filter cutoff frequencies are 0.4 Hz and 4 Hz. The HR fundamental range is roughly 0.4 Hz to 3 Hz, so using slightly wider bounds preserves beat-related harmonics. A median filter removes sudden spikes from the filtered signal. The AGC module limits signal amplitude to ±V volts to enable amplitude checks in later stages.
Long-duration PPG measurements introduce baseline drift artifacts. A low-pass finite impulse response (FIR) smoothing filter is applied to frame PPG samples to remove baseline drift and provide a smoother signal for the delineation module, as shown in Figure 2c.
High-Resolution Beat Extraction Module
The beat extraction algorithm contains the following blocks:
- Interpolation
- Delineation
- High-resolution beat extraction
- Signal quality metric
The preprocessing output is fed to an interpolation stage to improve timing accuracy. Given a PPG segment from t0 to tτ containing beats b0 and bτ and an interval τ, n-point linear interpolation is used between endpoints to derive beat intervals at higher resolution (for example, 1 ms). The delineation module relies on waveform morphology and rhythm information to extract peaks and onsets. The proposed delineator is conceptually similar to prior adaptive delineators used for PPG and invasive blood pressure waveforms. It adapts to wrist PPG by using pairs of inflection points and zero crossings derived from the first derivative of the signal. Figure 2d shows inflection points and zero crossings used for PPG delineation. For zero crossings, the signal is processed with a zero-phase filter to minimize startup and end transients while preserving time-domain features. Note that an onset in the derivative corresponds to a zero crossing before a major inflection while a systolic peak is associated with the zero crossing after that inflection.
The signal quality metric used by the algorithm is the clarity measure, which indicates the degree of tonal periodicity in the signal. This measure was originally proposed by Philip McLeod and Geoff Wyvill as a normalized squared difference function, a form of autocorrelation used to find periodicity. The clarity metric is used to determine when the beat algorithm can confidently report peaks and onsets.
Evaluation on ADI Wrist Platform
The PPG beat detection results were compared with the Pan-Tompkins algorithm, a standard ECG peak detection method. Data were collected using the ADI Vital Signs Monitoring (VSM) wristwatch platform. An iOS VSM application was used to connect to the watch via Bluetooth. The ADI watch records wrist PPG using a PPG sensor and simultaneously records ECG using three chest electrodes connected to the watch; the platform thus provides synchronized PPG and ECG signals. Figure 3a shows the ADI watch used for data collection, and Figure 3b shows the iOS app interface and sample signals from the platform.
Metrics and Results
Before computing beat-level metrics, an outlier removal process identifies missing or extra peaks in the Pan-Tompkins output and in the PPG beat algorithm output. Ignoring missing or extra peaks leads to abnormal beat intervals and inaccurate results. Missing or extra ECG peaks are identified by observing consecutive beat durations produced by the Pan-Tompkins algorithm; any ECG peak that changes beat duration by more than 20% is marked as an outlier. After removing these ECG outliers, missing or extra PPG peaks are identified by associating each ECG peak with nearby PPG peaks. If a PPG peak occurs near an ECG peak, it is associated with that ECG peak. If a PPG peak cannot be identified near an ECG peak, or if too many PPG peaks are found near an ECG peak, those PPG peaks are marked as outliers. Beat intervals caused by these missing or extra PPG beats are ignored during metric computation.
The following metrics were computed using the proposed algorithm and the Pan-Tompkins reference: (i) coverage; (ii) sensitivity (Se); (iii) positive predictive value (P+); and (iv) RMSSD. Figure 4 provides a schematic representation of values used for metric calculations.

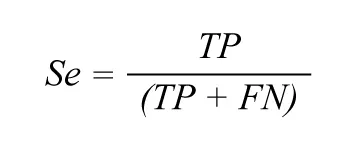
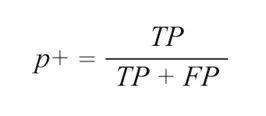
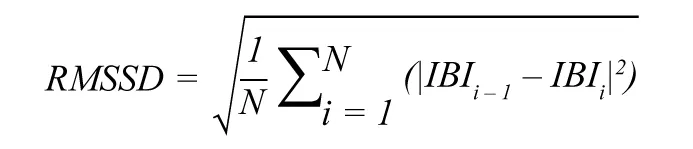
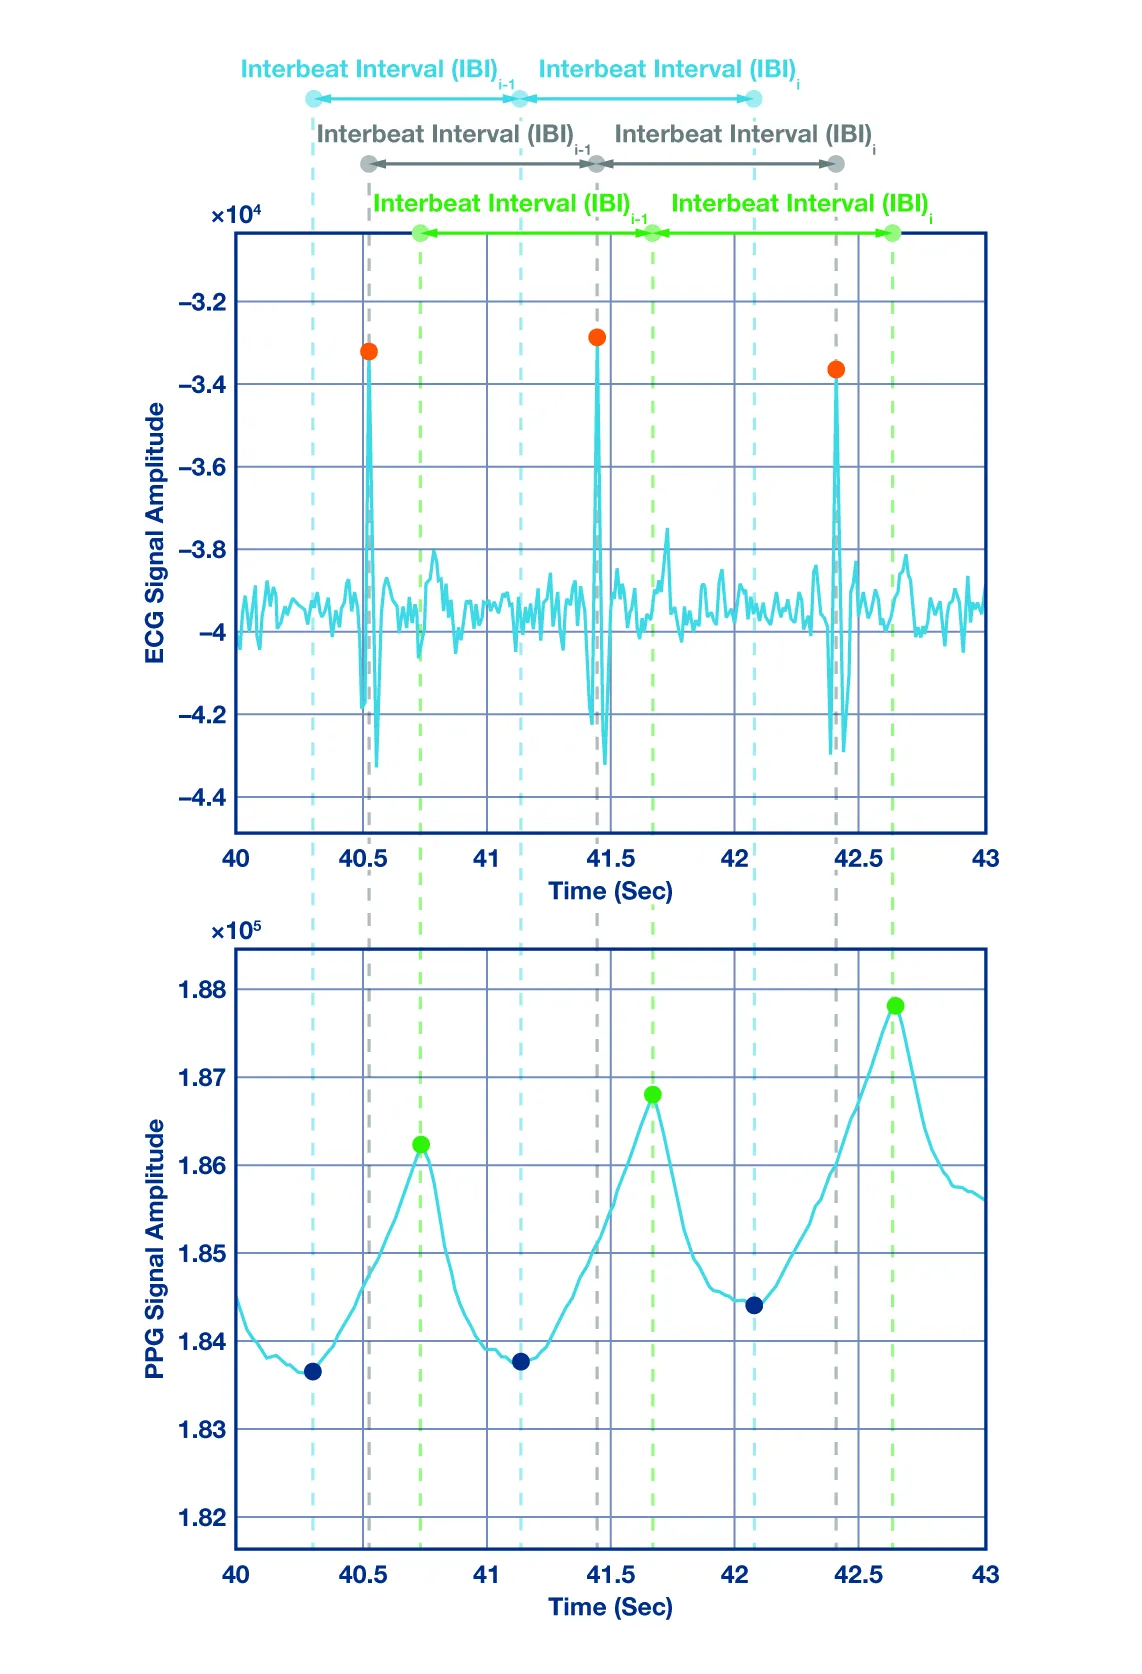
True positives (TP) are heartbeats correctly identified by the PPG beat-to-beat algorithm. False positives (FP) are PPG-detected beats that do not correspond to actual ECG beats. False negatives (FN) are beats the PPG algorithm missed. Inter-beat interval (IBI) denotes the time between consecutive ECG peaks, PPG peaks, or PPG onsets.
To evaluate the algorithm, synchronized PPG and ECG were collected for each subject. A diverse cohort of subjects with varying ages, skin tones, and body types was recorded to ensure generalizability. Data were collected from 27 subjects, male and female, each recording lasting 2 minutes 30 seconds. Subjects were recorded standing for the first half and resting for the second half. Table 1 shows mean metric results across subjects. Coverage, sensitivity, and positive predictive value exceed 83% on average, and the mean RMSSD difference for wrist data is under 20 ms compared with ECG results.
Discussion and Conclusion
This paper presents a robust peak and onset detection algorithm for wrist PPG signals to support PRV analysis. The method uses multistage preprocessing and a hybrid delineation algorithm to detect fiducial points in wrist PPG, and it was evaluated on a multisensor wristwatch platform. Results show strong correlation and agreement with ECG-derived HRV. Future work will focus on integrating motion suppression techniques and addressing missing-beat issues in PRV analysis.