ALLPCB


Summary
This article analyzes machine learning hardware performance trends, focusing on compute performance, memory, interconnect bandwidth, cost-performance, and energy efficiency across GPUs and accelerators. The analysis aims to provide a comprehensive view of ML hardware capabilities and bottlenecks. The analysis was produced by research firm Epoch, which studies AI development trajectories and governance issues.
Key findings
We examined GPU compute performance across different numeric representations, memory capacity, memory bandwidth, and interconnect bandwidth. The dataset includes 47 ML accelerators (GPUs and other AI chips) commonly used in ML experiments from 2010 to 2023, and 1,948 GPUs from 2006 to 2021. Main findings:
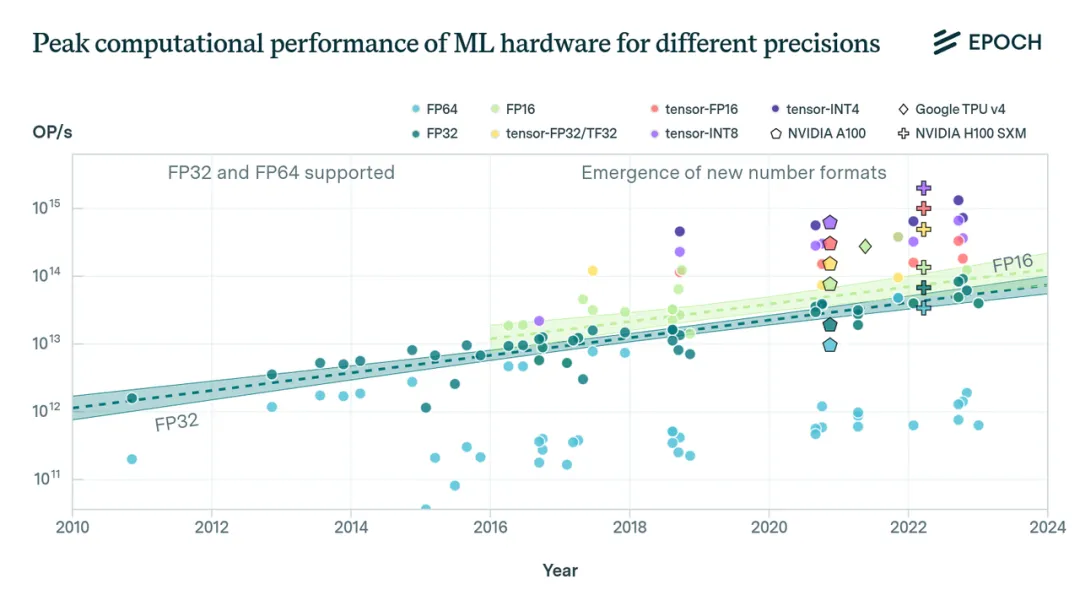
- Low-precision numeric formats such as 16-bit floating point (FP16) and 8-bit integer (INT8), combined with dedicated tensor-core units, can provide significant performance gains for ML workloads compared with traditional 32-bit floating point (FP32). For example, with limited data available, tensor-FP16 is estimated to be roughly 10x faster than FP32.
- System-level performance for SOTA ML model training and inference depends on factors beyond raw compute. We analyzed memory capacity, memory bandwidth, and interconnects and found that memory capacity doubles approximately every 4 years, and memory bandwidth doubles approximately every 4.1 years. These rates lag compute performance growth, which doubles about every 2.3 years. This disparity is commonly referred to as the memory wall.
- Modern ML hardware often includes proprietary chip-to-chip interconnect protocols, such as Nvidia's NVLink or Google's TPU ICI. These protocols provide higher communication bandwidth between chips compared with PCI Express. For example, NVLink on the H100 supports roughly seven times the bandwidth of PCIe 5.0.
- Key hardware performance metrics and their improvement rates observed in the analysis include: compute performance for both ML and general-purpose GPUs (in FLOP/s) doubling every 2.3 years; ML GPU cost-performance (FLOP per dollar) doubling every 2.1 years, while general-purpose GPU cost-performance doubles every 2.5 years; ML GPU energy efficiency (FLOP/s per watt) doubles every 3.0 years, and general-purpose GPU efficiency doubles every 2.7 years.
Performance table
![Table 1: Key performance trends for ML hardware. Estimates apply only to ML hardware. Bracketed values are [5; 95] percentiles from 1000 bootstrap samples. OOM denotes order of magnitude; N is the number of observations. Performance refers to dense matrix-multiply performance.](https://jpfile1.oss-accelerate.aliyuncs.com/allpcb/blog/f56383d0053c.webp)
The dataset and estimates focus on dense matrix-multiply performance and report confidence intervals from bootstrap sampling. OOM denotes order of magnitude and N indicates the number of observations in each dataset.