ALLPCB


Overview
Debugging RTOS-based projects is often more difficult than bare-metal development. Multiple threads and complex inter-thread data communication make tracing program flow and locating bugs challenging. Zephyr provides a tracing subsystem called Trace to address these difficulties. The Trace subsystem enables real-time tracing and debugging of embedded systems, allowing monitoring of OS runtime state, thread scheduling, and kernel services.
Feature Definition
The Trace subsystem in Zephyr is a debugging and tracing sub-system that can output information about thread scheduling, kernel services, and other OS events to a serial port or dedicated host-side tools for analysis.
Supported Formats
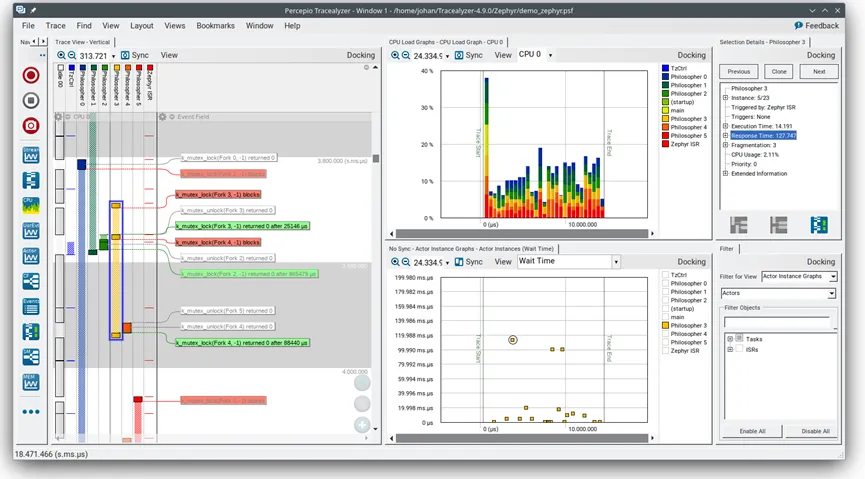
Zephyr supports multiple tracing output formats, including Percepio Tracealyzer format, Segger SystemView format, and Common Trace Format (CTF). Each format corresponds to different analysis tools such as Tracealyzer and SystemView.
Key Characteristics
- Real-time: The Trace subsystem can collect and transmit debug information in real time to help developers locate issues quickly.
- Flexible output: Multiple output methods are supported, including serial output and output via J-Link SWD to PC-side software.
- Configurable: Tracing formats and output methods can be configured to match different debugging workflows.
Use Cases
- Development debugging: During embedded systems development, Zephyr Trace helps developers monitor program runtime behavior and accelerate problem resolution.
- Performance analysis: Collected trace data can be analyzed to identify performance bottlenecks and guide optimizations.
Tools
Two commonly used tools are Percepio Tracealyzer and Segger SystemView.
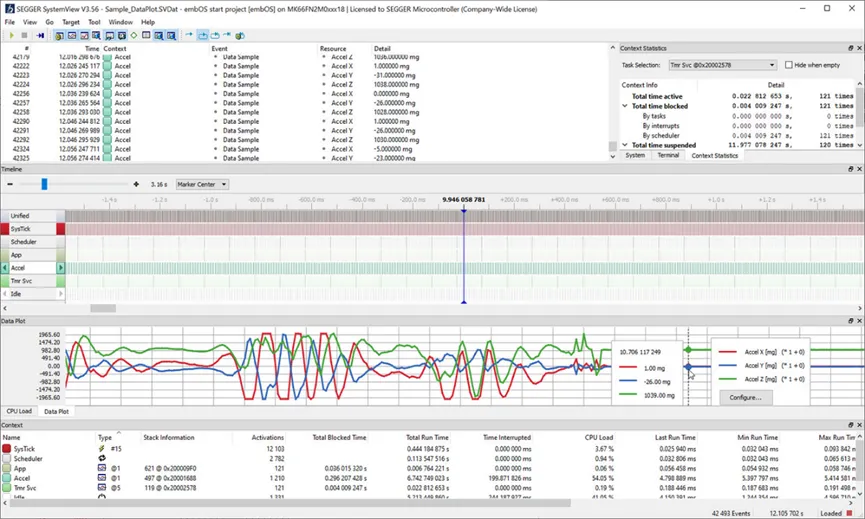
Example: Enabling Segger SystemView
Using Segger SystemView as an example, enable tracing by adding the following Kconfig options to your project configuration and rebuilding:
CONFIG_STDOUT_CONSOLE=y
CONFIG_THREAD_NAME=y
CONFIG_SEGGER_SYSTEMVIEW=y
CONFIG_USE_SEGGER_RTT=y CONFIG_TRACING=y
Summary
Zephyr Trace provides real-time tracing and monitoring capabilities that simplify debugging and performance analysis for embedded systems. Proper configuration and use of the tracing subsystem can improve development efficiency and help identify runtime issues more effectively.