ALLPCB


Switch-mode power supplies (SMPS) are found in nearly all modern electrical equipment. They are typically required to be as efficient as possible, with no-load power consumption controlled in the milliwatt range. A competing requirement is that the overall product cost must be as low as possible. As only standards-compliant products can enter the market, the time-to-market for new technologies becomes increasingly critical.
EMC filters are often a crucial part of the product optimization process. Selecting the correct EMC filter topology can save significant time in product certification and in optimizing electromagnetic compatibility (EMC) performance. Furthermore, an optimized EMC filter can reduce a product's cost and volume.
This article provides an in-depth perspective on EMC filter design. We will explain why it is important to consider the parasitic parameters of filter components and how to use practical simulation methods to accelerate the design process.
A product's success depends on its speed to market. Product certification is often a time-consuming step. If a product fails certification, a complete redesign may be necessary, increasing development costs. Delays in market entry can also lead to greater financial losses.
A closer look at the EMC emissions of a power supply reveals two main types: conducted emissions, typically in the range from several kHz to 30 MHz, and radiated emissions, generally from 30 MHz to several GHz. EMC power line filters are commonly used to reduce conducted emissions. The EMC filter in an SMPS can constitute a significant portion of the entire product. During development, time is always short, which often leads to rushing to complete a sample even before the product's market development phase is finished.
Due to time constraints, the initial solution may not be optimal. This can lead to filter redesigns and unnecessary costs; with this approach, the material cost of the filter can be as high as 15% of the total product price. A common technique in filter design is the "trial and error" method, which involves repeatedly swapping filter components like capacitors and inductors until the measured interference falls within EMC standard limits. With this approach, designers often fail to understand the effects of changing these parameters.
While this method may eventually yield a solution, is it the best one?
Interference Types: Common-Mode vs. Differential-Mode
To optimize EMC filter design, it is essential to understand the type of interference present. We also need to know which type of interference is dominant within a specific frequency band. Conducted emissions can be divided into differential-mode (DM) noise and common-mode (CM) noise. DM noise typically dominates at lower frequencies, below 1 MHz. In an SMPS, DM noise is mainly caused by the voltage drop across the equivalent series resistance (ESR) of the DC bus capacitor, which is generated by ripple current (e.g., from an active power factor correction circuit). CM noise usually dominates between 1 MHz and 100 MHz. In this frequency range, parasitic parameters and coupling paths must be considered. The type of noise has a significant impact on the design of the EMC filter. Once we know the interference type, parasitic parameters, and coupling paths, we can begin designing the filter.
Capacitive Inductors and Inductive Capacitors
The most common EMC filter structure for suppressing both CM and DM noise is the LC topology. Proper selection of the inductor is critical. One key point to consider is the frequency characteristic of the common-mode choke. Let's design an LC filter based on the topology shown in Figure 1.
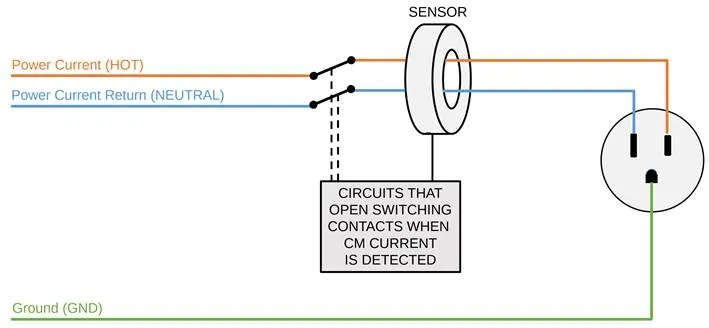
LC Filter Topology
The Cy capacitors are Y-capacitors. These capacitors form a low-impedance path back to the common-mode noise source (the power switches of the SMPS relative to ground). The L-CMM is a common-mode choke that creates a high-impedance path for common-mode currents. The Cx capacitor is placed across the DC power lines and, together with the leakage inductance of the common-mode choke, forms a differential-mode LC filter to suppress DM noise. The following discussion will be based on this fundamental schematic.
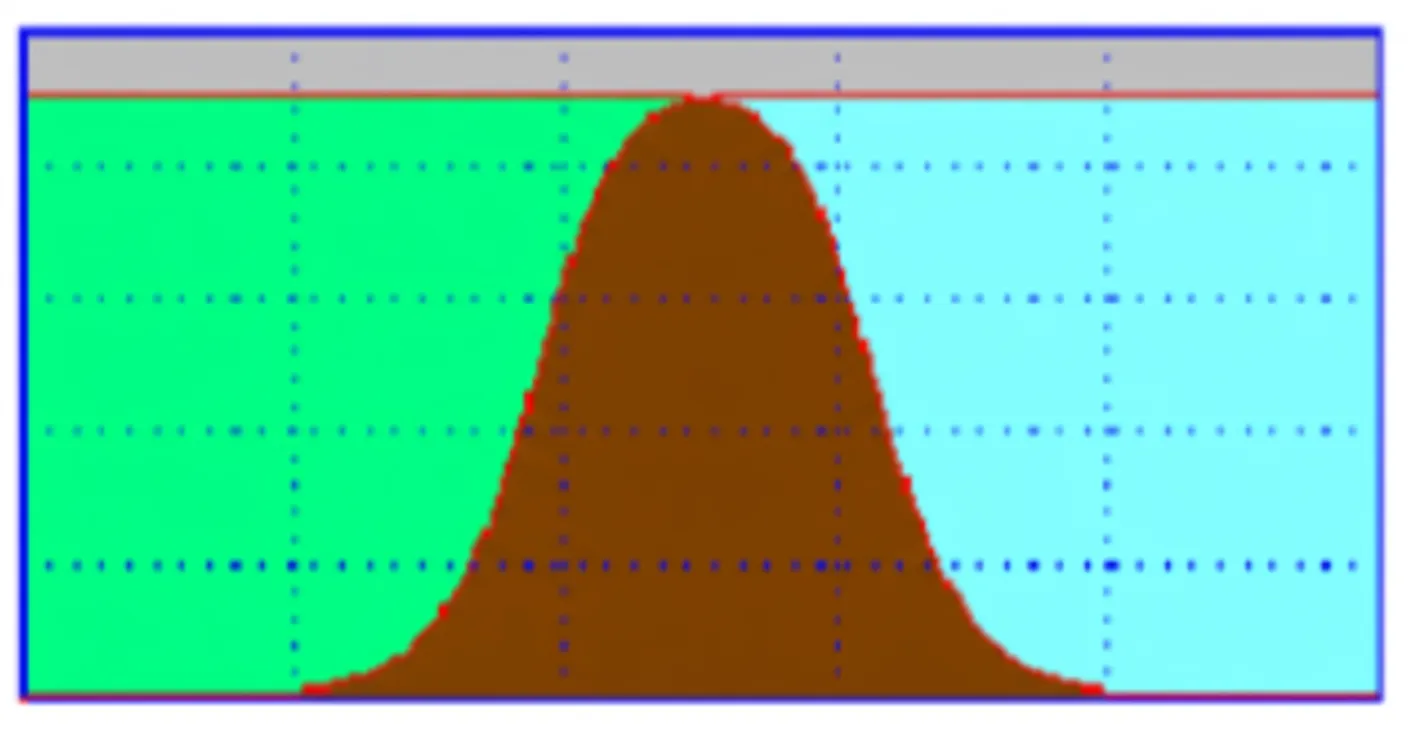
Below is the impedance characteristic curve for a 10mH common-mode choke. The blue curve represents the ideal characteristic of the 10mH inductor, while the red curve shows the actual characteristic, with a self-resonant frequency (SRF) at 200 kHz. Above this frequency, the common-mode choke behaves like a capacitor. We can also see that the resonant frequency of the choke's leakage inductance is around 20 MHz. If we are certain that common-mode noise is dominant above 1 MHz, we must consider the inductor's frequency characteristics.
Impedance characteristics of a 10mH common-mode choke
Impedance characteristics of a 2.2nF Y-capacitor
Now let's analyze the frequency characteristics of the Cy capacitor. Below is the impedance characteristic of a 2.2nF ceramic capacitor, with the measured values in red and the theoretical values in blue. Due to its low internal equivalent series inductance (ESL), this capacitor has excellent high-frequency performance, with a self-resonant frequency above 30 MHz. Because of this characteristic, such capacitors are often used to reduce conducted emissions. If you intend to use this capacitor to affect radiated emissions up to several hundred MHz, you must pay special attention to its frequency response range.
So far, we see that the actual characteristics of passive filter components are not ideal. It is clear that designing a filter based solely on theoretical values is insufficient for predicting its practical effectiveness.
EMC Filter Design Using Measured Component Data
The typical steps for optimizing an EMC filter are as follows: First, measure the noise spectrum. In the measurement results, try to separate the common-mode and differential-mode noise. If we know the noise amplitude and the EMC standard limits, we can calculate the required attenuation over a certain frequency range to comply with the standard. This required attenuation can be calculated in several ways.
One way is manual calculation with pen and paper, based on the theoretical values of capacitors and inductors. As mentioned earlier, this is not the best approach, especially at high frequencies where the parasitic parameters of the filter components must be considered. Another solution is to use SPICE simulation software. However, a meaningful simulation first requires deriving equivalent circuits for each filter component, accounting for all their parasitic parameters. Depending on the required accuracy and the number of components, this method can still be a time-consuming process.
Another solution is to directly use the measured impedance characteristic curves of the filter components for filter design and simulation. As we saw in the previous examples, the actual impedance curve includes the effects of parasitic parameters. If we can use the actual impedance curves of filter components directly in a simulation, we can obtain very accurate filter simulation results.
What do we need for this method?
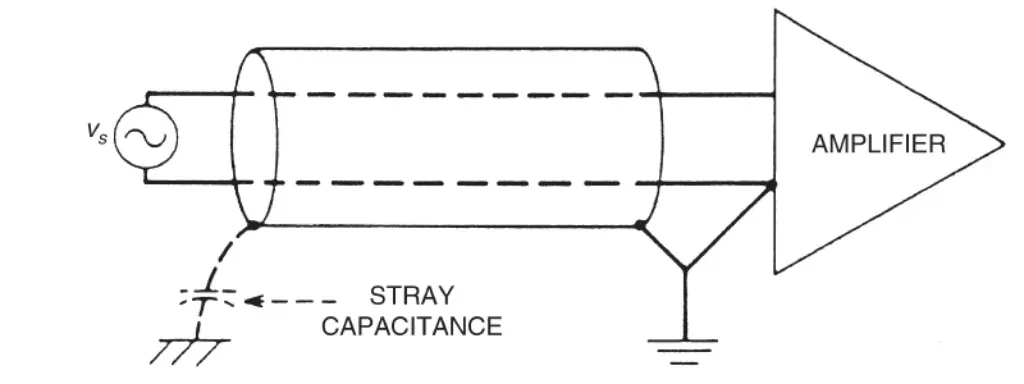
First, we need a Vector Network Analyzer (VNA) to measure the impedance and phase curves of the filter components over the desired frequency range. To obtain the simulations shown in this article, we used a VNA with an external impedance adapter to measure the filter components. Figure 4 shows such a setup for full-band impedance measurement.
Vector Network Analyzer (VNA) with external adapter
After measuring all the components for the required filter, we need a software tool that can integrate all the impedance curves to perform a filter simulation. For this purpose, we use the EFsyn software from Negal Engineering.
The software has a window for drawing the filter schematic. Behind the filter components (like the inductor marked in red), there is no SPICE model. Instead, we directly use the complex impedance curve of the component. This method has another advantage: it is very fast. Using a VNA, we can measure all the components from our parts bin that we want to use or might use for the filter design. After entering all the measured values into the component library, we can directly simulate a new filter that includes the effects of parasitic parameters.
Filter design software optimization based on measured impedance values
Optimization: When Filter Performance is Worse Than Expected
Let's design an LC-type common-mode filter as an example. We know that for conducted emissions, common-mode interference is mostly dominant between 1 MHz and 30 MHz. If we simulate the filter shown in Figure 1 based on the actual measured values of the inductor and capacitor, we get the following result:
Simulation results of the common-mode filter
In the simulation, the blue curve represents the frequency response of the common-mode filter based on ideal component values, while the red curve represents the response based on actual measured component values. For this simulation, we assume a source impedance of 100 ohms and a load impedance of 25 ohms. We can see that the first resonant frequency of the common-mode filter is at 200 kHz, caused by the self-resonance of the common-mode choke. The second resonance is near 20 MHz, caused by the choke's leakage inductance. There is another resonance near 30 MHz caused by the Y-capacitor, Cy.
At the 1 MHz cursor (red), the difference between the theoretical attenuation and the simulated attenuation from measured values is over 20 dB. This means the designed filter provides 10 times less noise attenuation than expected—and this is before considering other factors that degrade filter performance in a real application! This example shows the importance of practical considerations.
A Story from the EMC Lab
We have encountered many similar situations in the past: during prototype development, we sought a solution to reduce conducted and radiated emissions. For example, we replaced a 10mH choke with a 15mH choke. Our intuition suggested that the 15mH choke would be better. However, the result was that interference was reduced in one frequency band but amplified in another! The RF characteristics of the real components were the likely cause. Typically, for common-mode chokes of the same physical size, an inductor with a larger inductance value will have greater parasitic capacitance due to the increased number of coil turns, which may cause it to resonate at a lower frequency. With the method proposed in this article, this effect can be fully considered without spending a lot of time soldering circuits.
Conclusion
To find the optimal solution in the shortest possible time, a structured design method is highly recommended. First, we should identify the type of interference and the frequency range of interest. For interference above 1 MHz, the RF characteristics of the filter components must be considered. A simulation that accounts for the parasitic parameters and frequency characteristics of filter components leads to a more optimized solution, thereby reducing development time and product cost. Moreover, this approach also provides a better understanding of how EMC filters work.