ALLPCB


Capturing and analyzing I2C (Inter-Integrated Circuit) waveforms with an oscilloscope is an essential measurement task for debugging embedded systems and microcontrollers. I2C is a serial communication protocol used for short-distance device communication, commonly found in sensors, memories, and other peripherals. The following explains how to use an oscilloscope to capture and analyze I2C waveforms.
1. Understand I2C basics
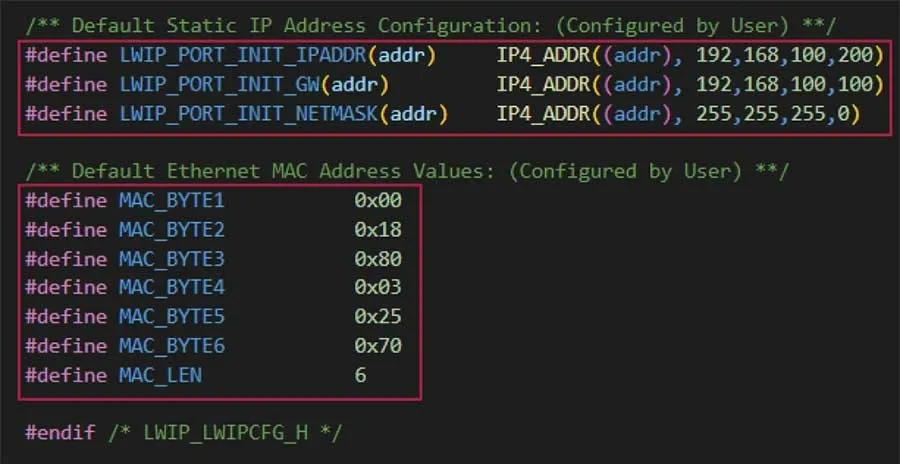
Before using an oscilloscope, become familiar with I2C fundamentals. I2C is a master-slave protocol with two lines: serial data (SDA) and serial clock (SCL). Data rates include standard mode (up to 100 kbps), fast mode (up to 400 kbps), and fast mode plus (up to 1 Mbps).
2. Prepare the oscilloscope and probes
Choose an oscilloscope with sufficient bandwidth and sample rate to capture I2C signals. Bandwidth should exceed the highest frequency components of the I2C signal. Use appropriate probes, such as passive probes with low loading, differential probes, or logic analyzer probes, to connect to SDA and SCL.
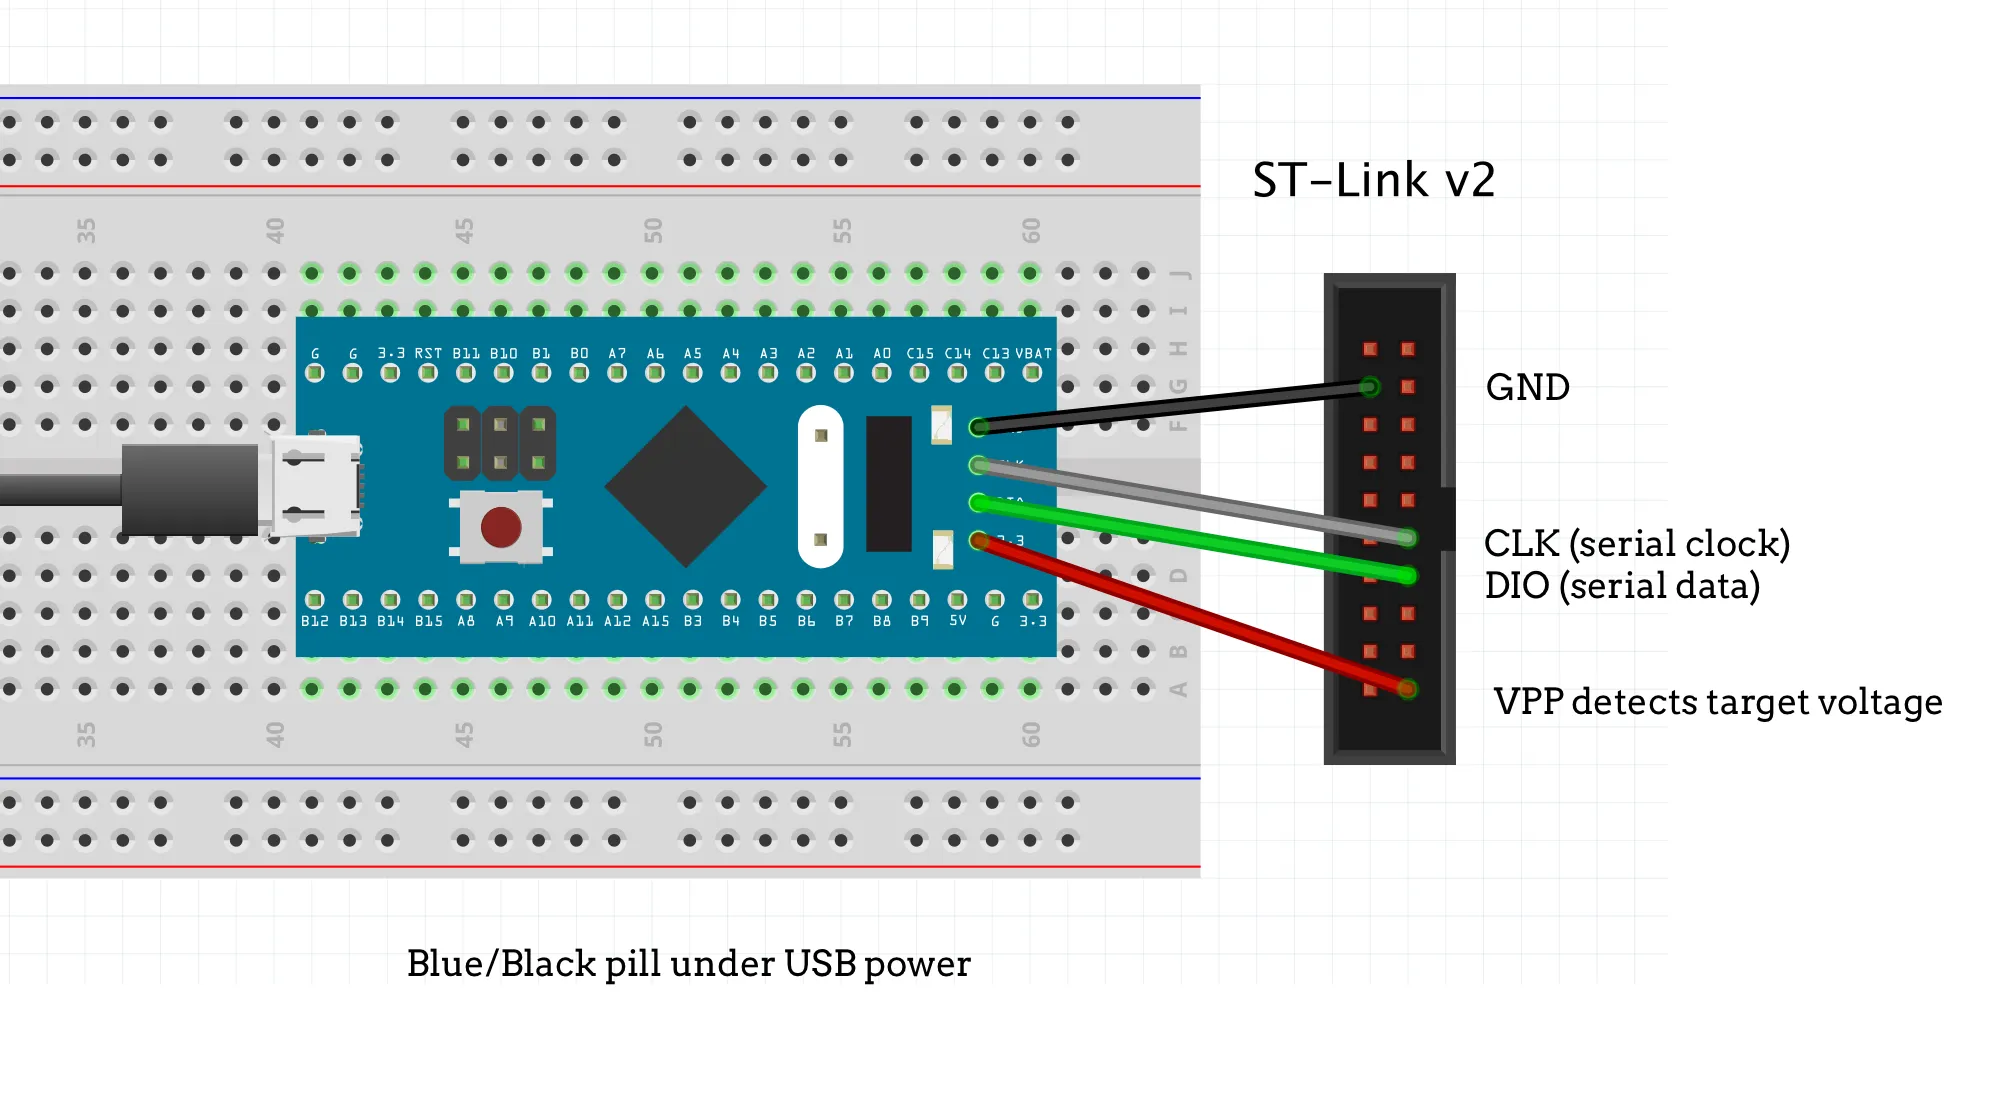
3. Connect the probes
Connect probes to the SDA and SCL lines of the I2C bus. Ensure good probe contact to avoid signal distortion from poor connections. If using logic analyzer probes, connect them to the corresponding oscilloscope channels as required.
4. Oscilloscope setup
Power on the oscilloscope and select channels for SDA and SCL. Adjust vertical scale (voltage) and horizontal scale (timebase) so that start conditions, address and data transfers, and acknowledge bits are clearly visible.
5. Trigger configuration
Set trigger conditions, typically edge trigger on SDA or SCL. Common choices are SDA falling edge or SCL rising edge. Adjust trigger timing based on the specific I2C traffic being observed.
6. Capture I2C waveforms
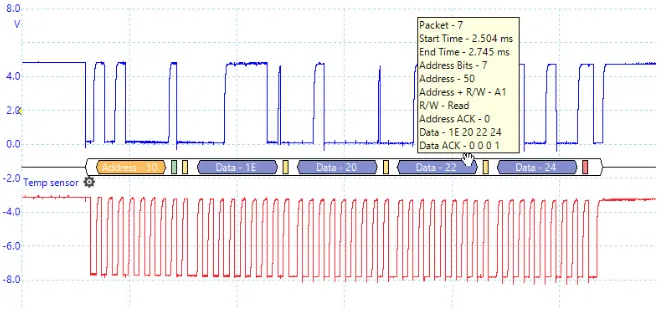
Begin capturing the I2C communication. Observe the start condition (SDA transitions high-to-low while SCL is high), data bits (8 bits or 16 bits depending on address or data), acknowledge bits (ACK or NACK), and the stop condition (SDA transitions low-to-high while SCL is high).
7. Analyze the I2C waveforms
Examine the captured waveforms and check critical points in the communication:
- Start condition: SDA goes from high to low while SCL remains high.
- Address and data transfer: Data bits are sampled on the rising edge of SCL within each clock cycle.
- Acknowledge bit: The receiver pulls SDA low on the next SCL rising edge to acknowledge.
- Stop condition: SDA goes from low to high while SCL remains high.
8. Use I2C protocol analysis tools
Many modern oscilloscopes include I2C protocol decoding. Use the decoder to simplify analysis and display addresses, data bytes, and status information directly.
9. Troubleshooting
If I2C communication fails, investigate the following:
- Signal integrity: Check that SDA and SCL are clean and free of noise or distortion.
- Timing issues: Verify that signal timing meets I2C protocol specifications.
- Bus contention: Check for multiple masters or devices driving the bus simultaneously.
10. Optimization and debugging
Based on analysis, adjust clock rate, improve signal integrity, or resolve bus contention as needed to optimize I2C communication.
11. Documentation
During debugging, record important waveform screenshots and analysis results to aid problem tracking and resolution.
12. Advanced analysis
For complex I2C issues, consider advanced techniques such as eye diagram analysis to evaluate timing margin or spectral analysis to inspect frequency characteristics.
Conclusion
Capturing and analyzing I2C waveforms with an oscilloscope requires a methodical approach. By understanding I2C, configuring the oscilloscope correctly, capturing and analyzing waveforms, and performing systematic troubleshooting, you can effectively resolve I2C communication problems.