ALLPCB


Overview
Electrochemical instrumentation has been miniaturized from rackmount or benchtop systems to handheld devices for point-of-care and environmental analysis. The next wave of instruments integrates potentiostats into small devices such as wearables, medical devices, or gas monitors. EmStat Pico is a compact system-on-module (30.5 mm × 18 mm × 2.6 mm) potentiostat developed by ADI in collaboration with PalmSens BV. The module includes ADI components such as ADuCM355, ADP166, ADT7420 and AD8606.
Design intent and application
EmStat Pico is intended to simplify electrochemical sensor system development by providing a pre-integrated potentiostat module. Electrochemical sensor integration ordinarily requires firmware, analog and digital electronics expertise plus electrochemistry knowledge. EmStat Pico lets designers integrate standard electrochemical techniques such as linear sweep voltammetry (LSV), square-wave voltammetry (SWV) and electrochemical impedance spectroscopy (EIS) with minimal firmware and analog design effort.
This article describes three electrochemical measurements implemented with EmStat Pico: open-circuit potential (OCP) for pH, cyclic voltammetry (CV), and EIS, and demonstrates integration examples and results.
System integration
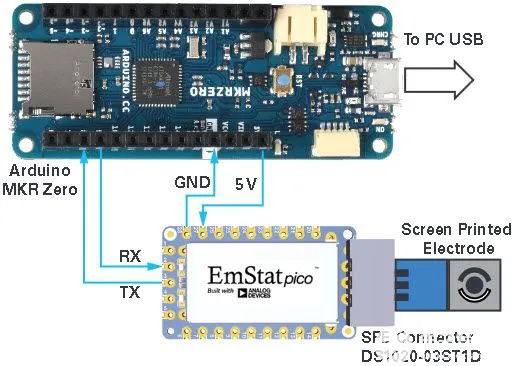
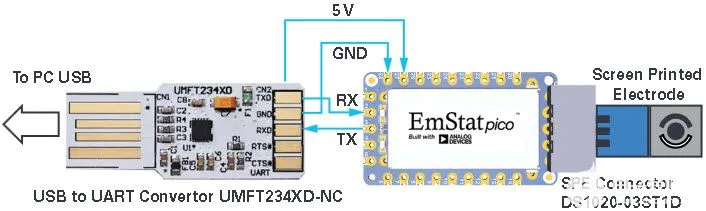
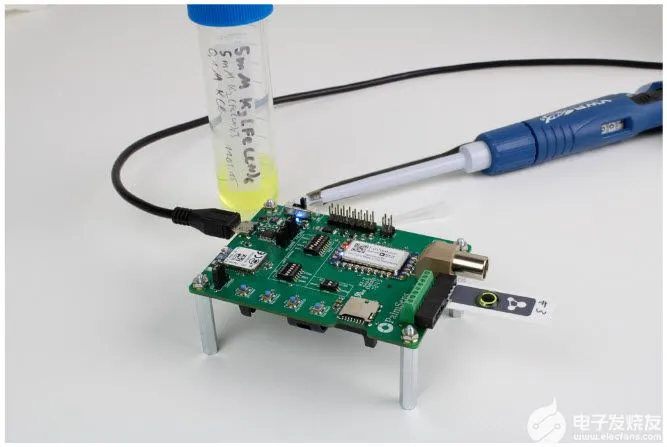
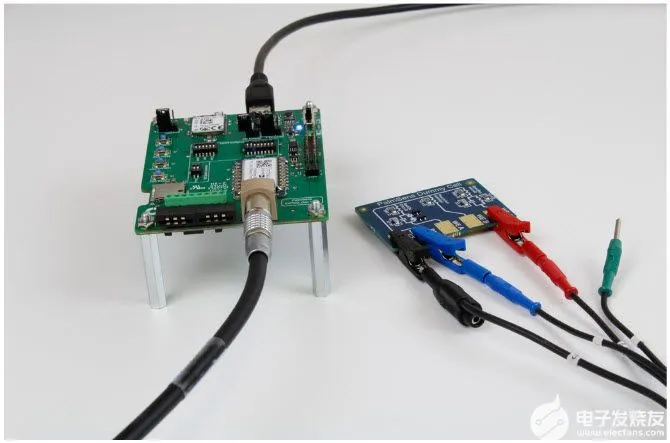
EmStat Pico is designed to integrate into any microcontroller-based system using four connections: 5 V, ground, TX and RX. Figure 1 shows example setups: (a) Arduino MKR as the master controller, and (b) a USB-to-UART converter for direct PC control. In both setups EmStat Pico connects to screen-printed electrodes (SPEs) for common electrochemical measurements such as cyclic voltammetry.
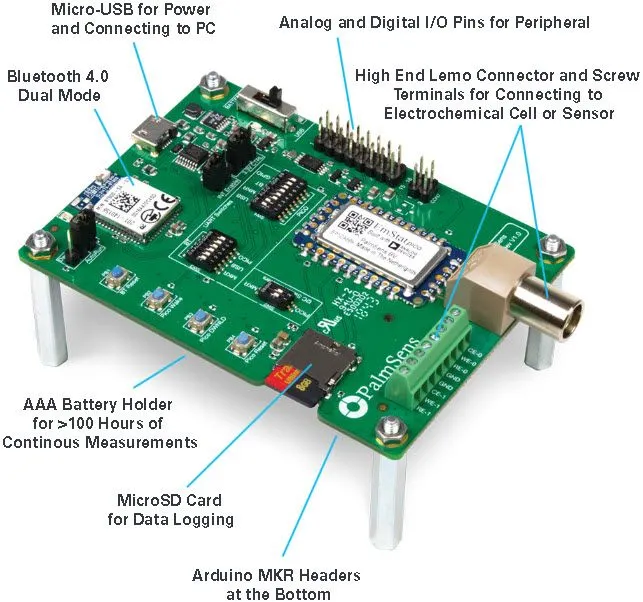
Development board
The EmStat Pico development board breaks out the SOM and adds features for standalone operation, including battery power and SD card, USB and Bluetooth communication options, a real-time clock for timestamps, EEPROM for calibration data storage, and a connector for direct insertion into an Arduino MKR.
Software interface
For laboratory and bench applications EmStat Pico can be operated from a PC using PSTrace PC software over USB. For OEM use, communication is via UART. The host can control EmStat Pico using method scripts, the EmStat Pico script language. Method scripts are human-readable scripts used to program EmStat Pico to run electrochemical techniques and other functions such as loops, SD data logging, digital I/O, reading auxiliary values such as temperature, and sleep modes. Method scripts can be generated in PSTrace or written manually.
pH measurement (OCP)
pH is one of the most common electrochemical measurements and ranges from 0 to 14 (acidic: 0, neutral: 7, alkaline: 14). Measurements typically use a hydrogen-ion-selective glass electrode that produces a voltage response or open-circuit potential (OCP). Because OCP measurements require minimal current flow, high input impedance is required. pH electrodes can have settling times up to 30 s, and the response is temperature-dependent.
Typical measurement parameters:
- Voltage response: at 25°C –59.16 mV per pH unit
- Resolution: ±0.02 pH units, implying voltage resolution < 1.18 mV
- Temperature dependence: 0.2 mV/pH unit/°C
- Required input impedance: > 100 GΩ
Setup:
- Device: EmStat Pico on the development board
- pH electrode: Voltcraft PE-03
- Buffer solutions: pH 7 and pH 4
| Signal | Development board pin | pH electrode |
| RE_0 | Con4 pin 6 | Inner core |
| WE_0 | Con4 pin 7 | Outer sheath |
For this test the pH electrode was connected to the RE_0 input and referenced to WE_0. Note that this orientation produces an inverted voltage response. The RE_0 input is buffered by the AD8606 op amp on EmStat Pico to provide input impedance > 1 TΩ. The potential RE_0 versus WE_0 was recorded for 2 minutes while transferring the electrode between pH 4 and pH 7 buffers every 20 s. After removing the ISE from one buffer it was rinsed with deionized water before immersion in the other buffer.
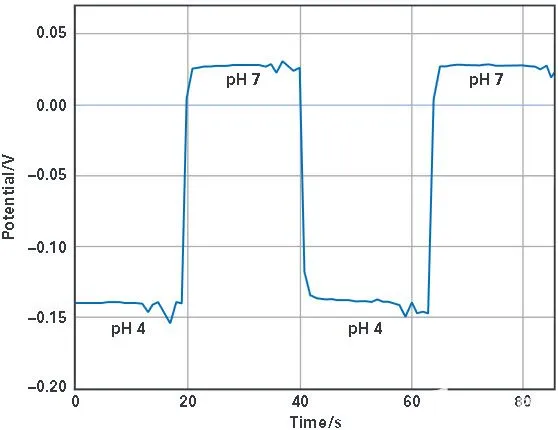
| pH standard | Potential |
| 4 | –0.14 V |
| 7 | +0.03 V |
The potential difference between pH 4 and pH 7 was 0.17 V, corresponding to a slope of 56.7 mV/pH. The theoretical Nernst slope at 25°C is 59.16 mV/pH, so the measured sensitivity is adequate for pH sensing.
Cyclic voltammetry (CV)
Cyclic voltammetry applies a voltage ramp to an electrode immersed in solution and then reverses the ramp while measuring current. The forward and reverse sweeps produce anodic and cathodic currents associated with oxidation and reduction of redox-active species at the electrode interface. CV is commonly used to detect and quantify electroactive species and to characterize redox chemistry.
Typical measurement parameters:
- Applied voltage: –1 V to +1 V
- Step size: 10 mV
- Current range: ±10 nA to ±1 mA
- Sweep rate: 100 mV/s
Setup:
- Device: EmStat Pico on the development board
- SPE: LP-3.13.WP.350, LanPrinTech
- SPE connector: DS1020-03ST1D
- Potassium ferricyanide K3[Fe(CN)6]
- Potassium ferrocyanide K4[Fe(CN)6]
- Potassium chloride supporting electrolyte
| Signal | Development board pin | SPE electrode |
| RE_0 | Con4 pin 6 | RE |
| WE_0 | Con4 pin 7 | WE |
| CE_0 | Con4 pin 8 | CE |
Solutions of 5 mmol/L K3[Fe(CN)6] and 5 mmol/L K4[Fe(CN)6] were prepared in a 1:1 molar ratio with 0.1 mol/L KCl as supporting electrolyte in distilled water. The SPE connector was placed in the PSTAT_0 channel and 200 μL of the ferri/ferrocyanide solution was deposited on the active SPE surface.
EmStat Pico was configured to run CV on PSTAT_0 with parameters: applied potential –0.4 V to +0.7 V, step size 10 mV, sweep rate 100 mV/s. Data were recorded with PSTrace.
Results
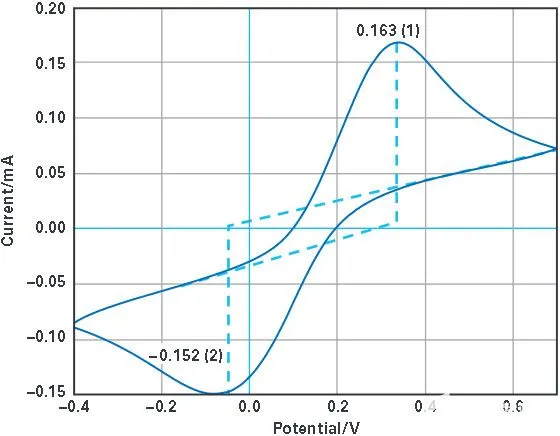
| Potential | Current | |
| Oxidation | +340 mV | +0.163 mA |
| Reduction | –80 mV | –0.15 mA |
The CV trace shows an oxidation peak at +340 mV with peak current +0.163 mA due to oxidation of [Fe(II)(CN)6]4– to [Fe(III)(CN)6]3–, and a reduction peak at –80 mV with peak current –0.15 mA on the reverse sweep. Peak current scales with the concentration of electroactive species, making CV suitable for sensing. The midpoint of the peak potentials (~180 mV) corresponds to the formal potential of the redox couple.
Electrochemical impedance spectroscopy (EIS)
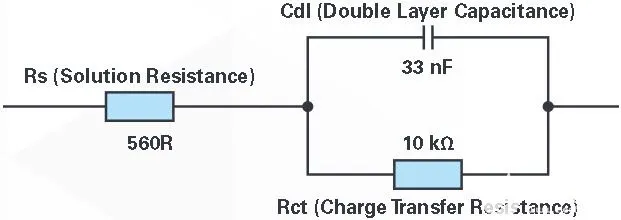
EIS is used to examine interfacial chemistry on surfaces such as corroding surfaces or battery electrodes. A small sinusoidal potential is applied and the current response is measured over a frequency range from below 1 Hz up to MHz. Electrochemical interfaces can be modeled with equivalent circuit elements. A common model is the Randles circuit of resistors and a capacitor. The Randles model used here omits the Warburg diffusion element. PalmSens provides a test kit with three test circuits including a Randles circuit with nominal values shown in Figure 8c. In that model Rs is solution resistance, Cdl is the double-layer capacitance, and Rct is the charge-transfer resistance.
EIS data are typically plotted as Nyquist plots or Bode plots and fit with an equivalent circuit model to extract element values.
Typical measurement parameters:
- Excitation amplitude: 10 mV peak-to-peak sine
- DC offset: 100 mV
- Frequency range: 0.1 Hz to 100 kHz
- Current range: ±100 nA to ±1 mA
Setup:
- Device: EmStat Pico on the development board
- Sensor cable: PalmSens sensor cable
- Randles equivalent circuit: PalmSens dummy cell
| Signal | Development board pin | Cable color | SPE electrode |
| RE_0 | Con8 pin 1 | blue | RE |
| WE_0 | Con8 pin 5 | red | WE_C |
| CE_0 | Con8 pin 3 | black | CE |
The sensor cable was inserted into CON8 on the EmStat Pico development board and crocodile clips connected to the Randles dummy cell. EmStat Pico was configured to run EIS on PSTAT_0 with DC voltage +1 V, sine amplitude 10 mVpp, and frequency range 10 Hz to 200 kHz. PSTrace used a Levenberg-Marquardt algorithm to fit an equivalent circuit and compute element values.
Results
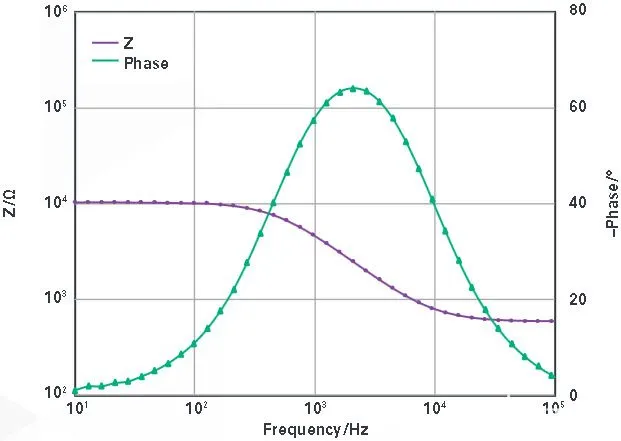
Figure 8a shows the Bode plot of the Randles circuit from Figure 8c. At low frequency the 10 kΩ resistor dominates because the capacitor impedance is large. At higher frequencies the impedance drops toward the solution resistance as the capacitor effectively shorts the interface.
Figure 8b shows the Nyquist plot of the measured data (blue) and the fitted model (orange). The circuit element values calculated from the fit match the nominal values of the dummy cell closely. Note: resistor tolerance 0.1%, capacitor tolerance 5%.
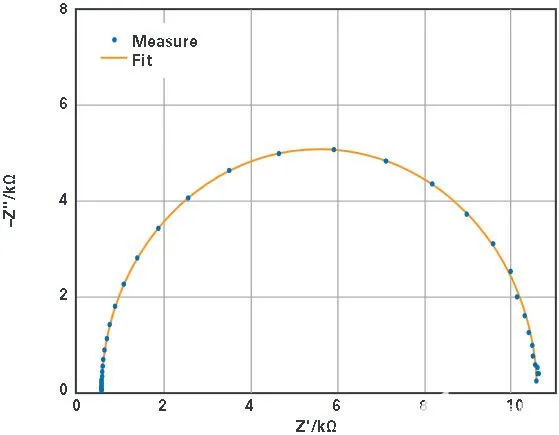
| Circuit parameter | Nominal | Fitted |
| Rs | 560 Ω | 560.5 Ω |
| Rp | 10 kΩ | 10.01 kΩ |
| Cdl | 33 nF | 33 nF |
Conclusion
EmStat Pico is a compact, configurable potentiostat capable of performing common electrochemical techniques. Its small system-on-module form factor is suitable for integration into miniaturized sensing systems. The module is built around ADI components including ADuCM355, AD8606, ADT7420 and ADP166.