ALLPCB


Background
Weather monitoring equipment plays an important role in daily life and production. As meteorological science and technology advance, a variety of monitoring devices are now used in routine observation. Accurate meteorological data are the foundation for providing weather services.
This project uses the Spark-1 development board and onboard peripherals to implement a simple weather monitoring system. It uses RT-Thread Studio for software engineering, configuration, and debugging.
Hardware Selection
Sensor selection considerations
After deciding on a system that synchronizes data in real time, the design focused on integrating available peripherals. In addition to basic temperature and humidity sensing, the system should monitor harmful gas particles, so a gas sensor was considered. An MQ-2 sensor was planned but was not applied due to time and technical constraints.
Final peripherals and sensors
- STM32 F407 microcontroller: serves as the main controller for system control and data processing, offering sufficient processing capability and a range of peripheral interfaces.
- AHT10 temperature and humidity sensor: used to measure temperature and relative humidity. Communication with the STM32F407 is via the I2C protocol, transmitting the collected data to the main controller.
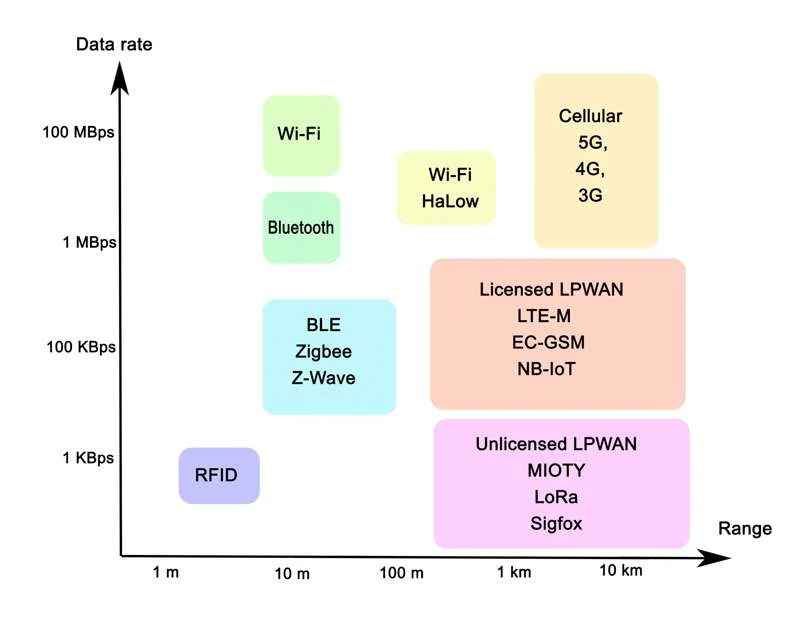
- RW007 Wi-Fi module: used for wireless data transmission. It supports IEEE 802.11b/g/n wireless connectivity.
- 19-LED matrix module: uses LED color and the number of lit LEDs to indicate temperature and humidity ranges.
- LCD screen: displays collected temperature and humidity data digitally in real time.
The MQ-2 gas sensor was purchased but not integrated into the system due to time and technical issues.
Technical Functionality
Program operation logic
- Read temperature and humidity from the AHT10 sensor.
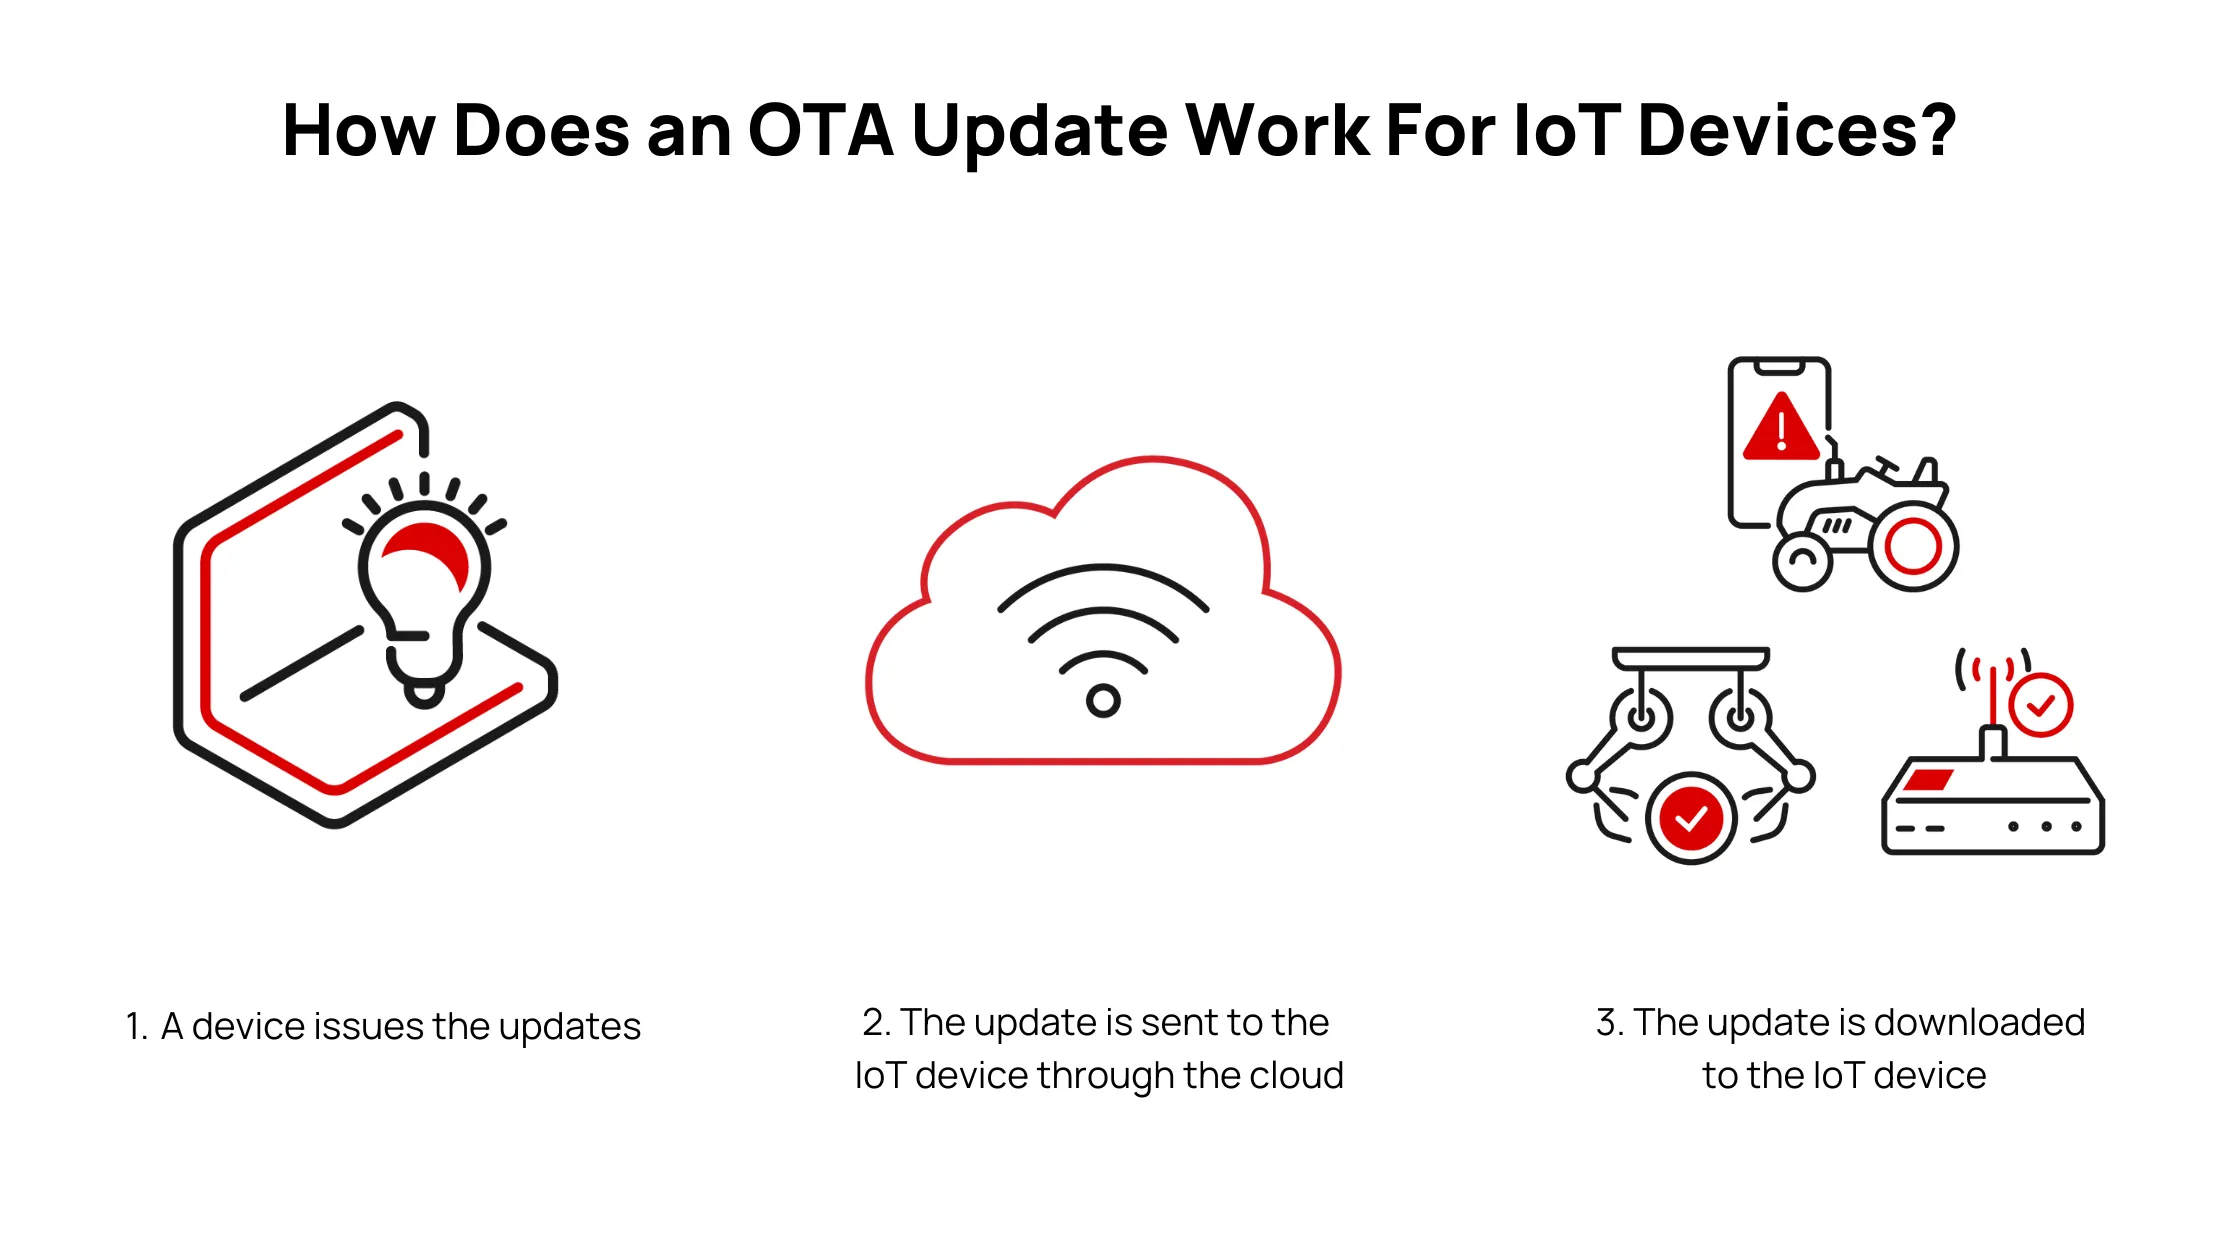
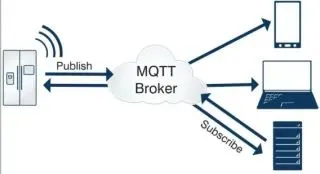
- Use the RW007 module with MQTT to synchronize the read temperature and humidity data to the OneNet cloud platform. The development board requires transferring the parameters and settings created on OneNet's multi-protocol access page into the project RT-Thread Setting package.
- The cloud platform generates corresponding signals and sends them to the OLCD screen. The OLCD screen visualizes the sensor data and adjusts concentric circle sizes based on data change.
- The LED matrix displays different temperature and humidity ranges by varying LED color and the number of lit LEDs.
Project Progress
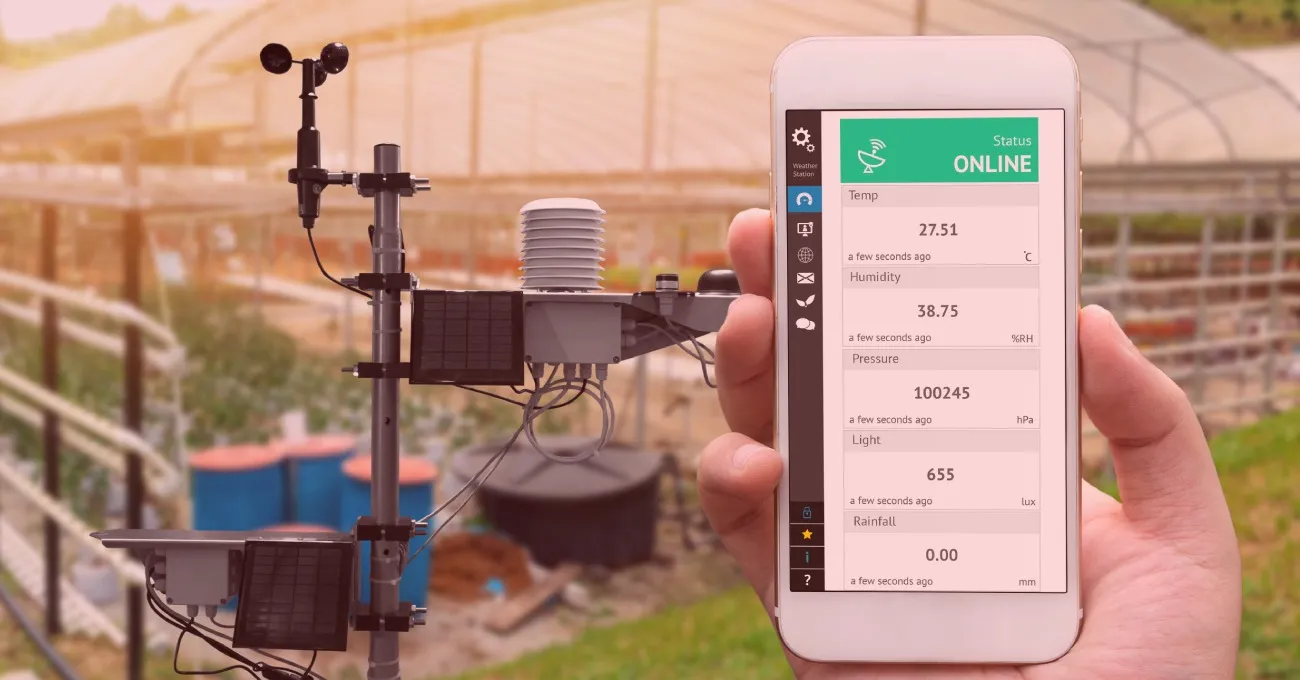
OneNet data visualization
Terminal network initialization process
The development board needs the parameters and settings created on OneNet's multi-protocol access page to be entered into the RT-Thread Setting package. After the necessary includes, use the following calls to connect and initialize the network and MQTT client: rt_wlan_connect("wifiname","password"); onenet_mqtt_init();
Terminal output after networking
After the terminal is online, it synchronizes and outputs data to the cloud platform.
OLCD screen real-time data updates
The OLCD screen receives signals from the cloud and updates visual elements to reflect current sensor readings in real time.
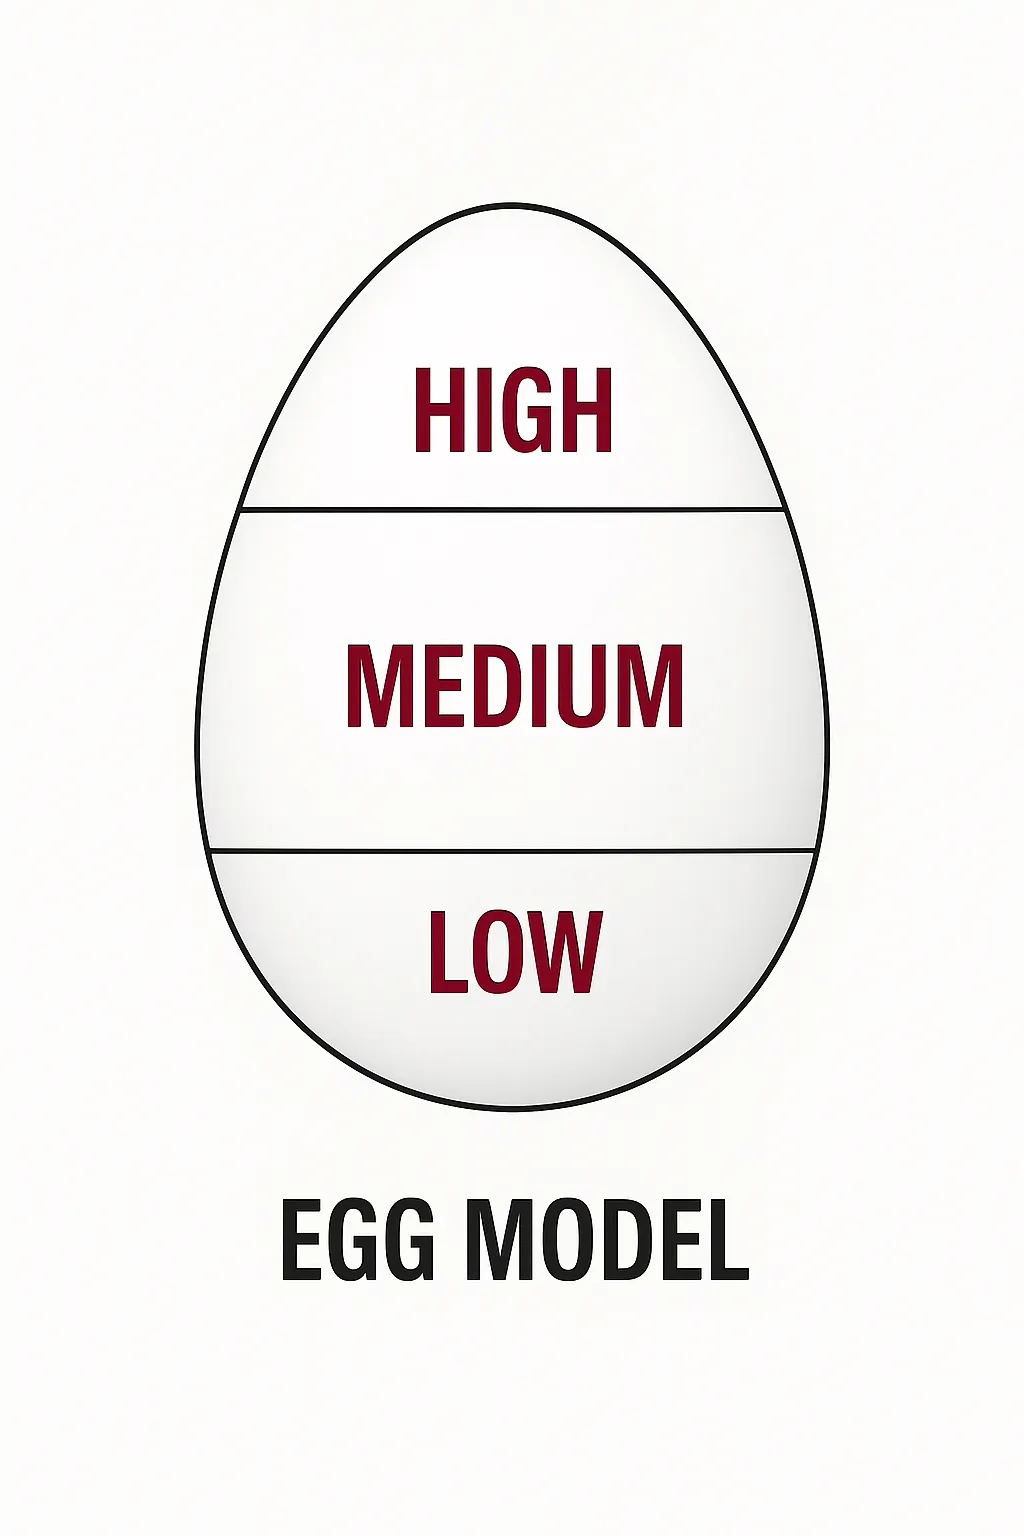
LED matrix feedback for different temperature and humidity ranges
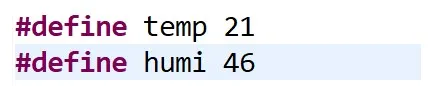
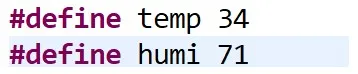
For demonstration, specific temperature and humidity values were entered manually to show the LED matrix behavior.
- Humidity below 60%, temperature 21 C:
- Humidity between 60% and 80%, temperature 34 C:
- Humidity above 80%, temperature 28 C: